How to create a tree inventory: from survey to register
Creating a tree inventory means that every tree gets a point on the map, with its own number and a fixed set of attributes. You get there by bringing in the data you already have, surveying what is missing in the field, and after that recording every change where it arises. This article describes practice in the Netherlands.
7 min read
What a tree inventory is
A tree inventory is the register of all the trees you manage: per tree a point on the map, a unique number and a fixed set of attributes. You also come across it as a tree register, tree map or tree survey, although that last one is really the work that produces the inventory. In Dutch it is called a bomenbestand, and this article describes Dutch practice, with the data sources and standards used there.
Three things turn a list into a tree inventory. Every tree has a location, so you can find it again and select it on the map. Every tree has its own number, so this year's inspection belongs to the same tree as the one from three years ago. And the inventory is current: what has been felled is no longer in it, what has been planted is.
The inventory is the basis under everything else. You cannot set out an inspection round, have a pruning contract priced or answer a question from the council about trees you do not know. How the inventory fits into the whole is covered in tree management in a municipality.
Which data you record per tree
Record what you are going to use, and no more. Every field you add has to be filled in by someone for thousands of trees, and kept up to date afterwards. A workable core:
- Number and location
- A unique tree number and the coordinates. In the Netherlands you usually work in the Rijksdriehoeksstelsel (RD), the national grid; GPS and web maps use WGS84. Record which system your inventory is in.
- Species
- The scientific name, from a fixed list. Free text gives you ten spellings of the same lime.
- Dimensions
- Stem diameter and tree height, in classes. A class is quicker to record than an exact measurement and is enough for management.
- Condition and safety
- The condition of the tree, and after a tree safety inspection the safety class, the defects and the advice.
- Growing site
- What the tree stands in: paving, grass or planting. That determines the growing conditions, and what maintenance involves.
- Management
- The tree type or pruning form, the manager or owner, and the planting year if you know it.
For the classes and pick lists, use the classification the sector uses, in the Netherlands that of Handboek Bomen, the Dutch reference work for tree care and tree inspection. Then every inspector and every contractor understands your inventory without a translation table. If your organisation works with IMBOR (in Dutch), CROW's information model for public space, align the field names with it.
Every attribute comes with a date and a source. A condition without a date says nothing: is it from last year or from the first survey? It looks like a detail, but it is the difference between an inventory you can plan on and one you first have to walk through. IDA Bomen records with every value where it comes from, with date and person. So you see whether a condition comes from your old file or from last year's inspection.
Three ways to survey
- Fieldwork
- A surveyor walks the area and records every tree on a tablet or phone. You get everything in one go, including species and condition. It is the most work and takes someone who knows trees.
- Aerial photos and height data
- Trees can be recognised on aerial photos and in height data collected by laser from an aircraft. That quickly gives a location, a height and a crown spread, but no species, no condition and no defects.
- Combining the two
- First the points from the data, then into the field to check and complete them. The surveyor no longer has to measure positions and spends their time on what only they can judge.
Open data helps with the second way. The Actueel Hoogtebestand Nederland (AHN, in Dutch) is the digital elevation map of the whole of the Netherlands, collected by laser altimetry and free to use. Current aerial photos are available as open data too. In the Basisregistratie Grootschalige Topografie (BGT), the Dutch base register of large-scale topography, a municipality can include trees, but that part is optional. Whether your trees are in it, and how current they are, therefore differs per municipality. In IDA the aerial photo and the elevation map from PDOK, the Dutch national geodata service, are ready as map layers, and you see the measured tree crowns from the AHN on the map. A point that lies beside its crown then stands out at once.
Bringing in existing data
Almost nobody starts from zero. There is an old survey, an export from a previous system, a layer in the GIS or a spreadsheet from the contractor. That data is worth more than it seems, if you bring it in with care.
Gather what there is
Collect all the files and determine for each how old it is, which area it covers and who made it. Choose one file as the basis.
Check the location
Find out which coordinate system each file is in. A file in the wrong system puts your trees hundreds of metres away, or in the sea.
Match the columns
Decide which column belongs to which field, and convert values to your pick lists: ‘good’, ‘Good’ and ‘G’ become one value.
Take out duplicates
Two sources often contain the same tree, just next to each other. Decide which source takes precedence.
Look at the map
Lay the result over a recent aerial photo. Points on roofs, in water or on a junction stand out at once.
Keep the provenance when you bring data in: this value comes from the import of that file, on that date. Later you will want to know whether a stem diameter was measured in the field or comes from a ten-year-old file. If you move to IDA, we migrate your existing data for you, whether it is a shapefile or a spreadsheet. Every value then remembers that it comes from your old file.


Keeping the inventory current
A survey is a snapshot. The day after, a tree is felled, and from that moment the inventory lags behind, unless keeping it up is part of the ordinary work. Three agreements make that happen:
- Every action on a tree goes into the inventory. Inspection, pruning, felling and planting, at the tree itself, at the moment it happens. No separate list that gets processed later.
- Whoever works outside reports what is wrong. A tree that is no longer there, a tree that is missing, a species that is incorrect. The inspector and the contractor come to every tree and are your best source.
- One person decides what goes in. Reports from the field are proposals. The tree manager reviews them, so that one day's mistake does not end up in the register unnoticed.
In IDA the inspector and the contractor record their work at the tree, in the field app, and a report only enters the register after your approval. Put these agreements in the contract with your contractor as well. How that works is covered in working with a contractor.
Your tree inventory in IDA
We migrate your existing inventory to IDA: a shapefile or GeoPackage from your GIS, an Excel list from your contractor or an export from your current system. Whatever you have, we can work with it, and it is part of onboarding. If an inspection comes over it later, you see both at the tree: the new value with the inspection as its source, and the old one in the history.
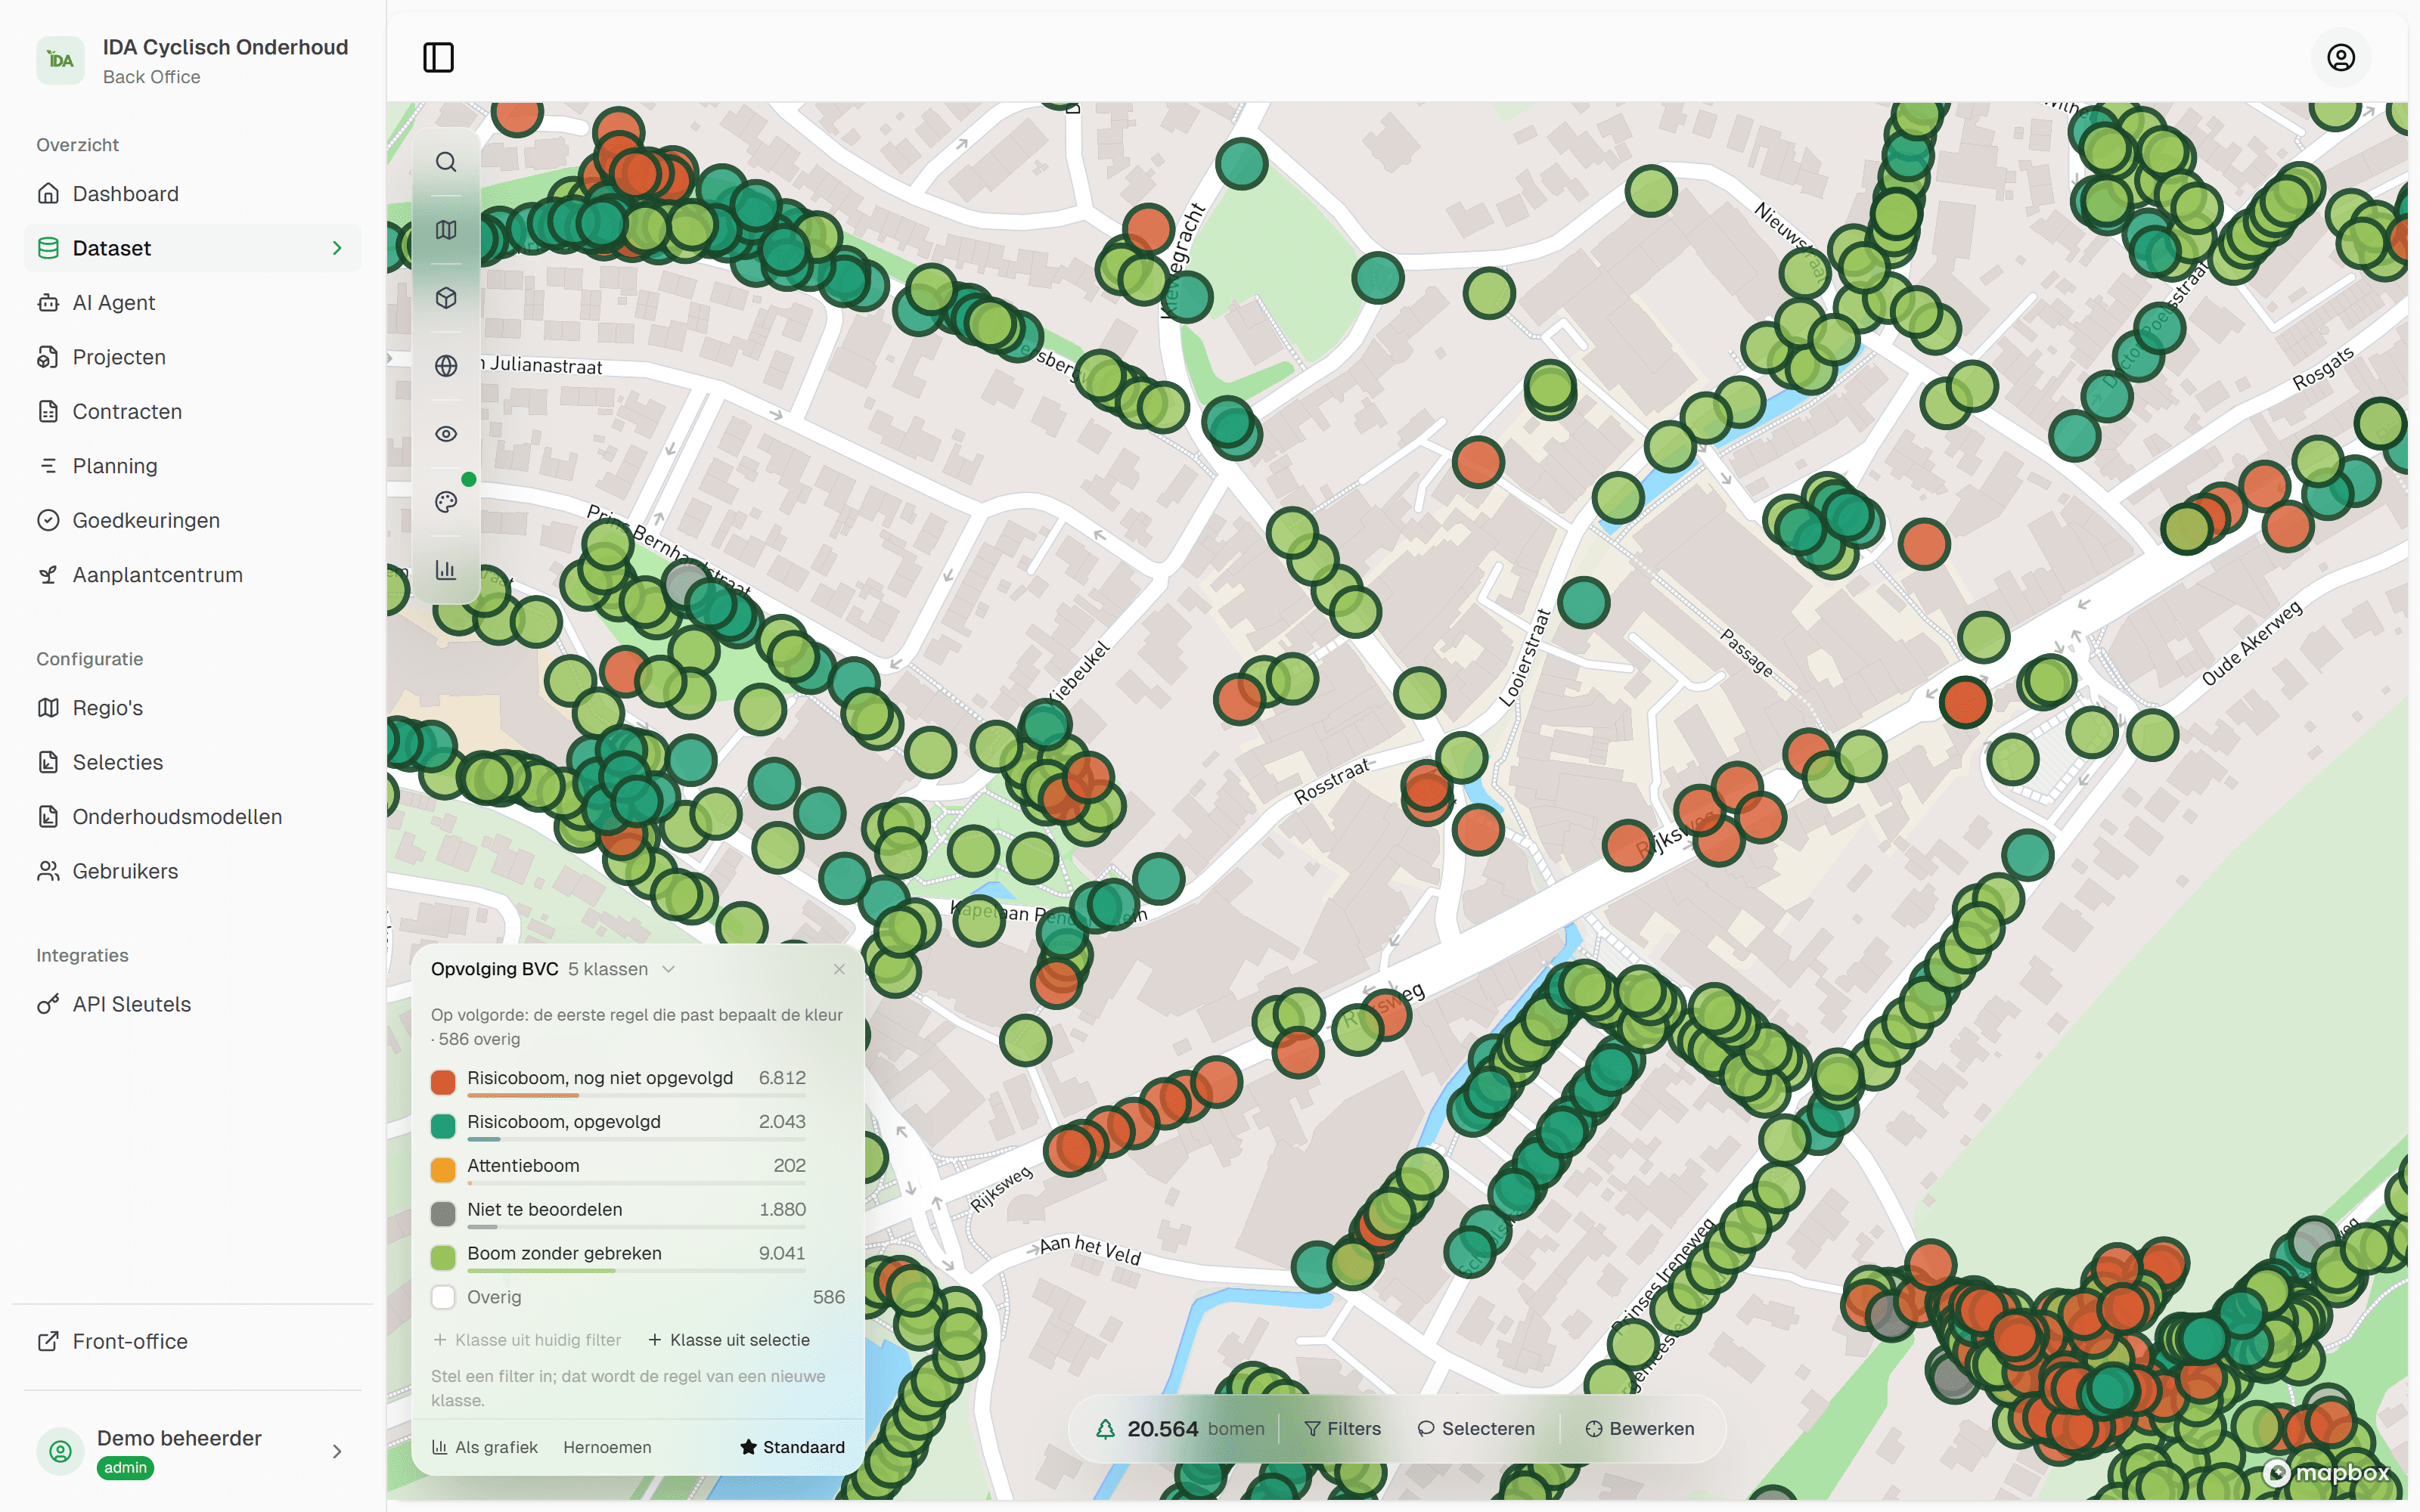
After that the trees are on one map. You put the current aerial photo, the infrared photo, the cadastral parcels and the elevation map from PDOK underneath as layers.

Surveying in the field is done in an inventory project. The surveyor adds trees on a phone or tablet, with their own position on the map. A tree in the wrong place is moved, and a tree that is gone is taken off. New trees first sit in a queue, and you approve or reject them, per tree or for a whole project at once.
Keeping it up works the same way. If a contractor sees while pruning that a value is wrong, they report a deviation with photos, and you decide whether it goes into the inventory. Planned planting is ready as a draft tree and becomes a tree in the register as soon as the planter confirms it in the field.
Frequently asked questions
That depends on the number of trees, how many attributes you record per tree, how accessible the trees are and what data already exists. A survey with only location, species and dimensions is less work than one you combine with a tree safety inspection. Ask for quotes based on the same list of attributes, otherwise you are comparing different things.
Perhaps. In the Basisregistratie Grootschalige Topografie, the Dutch base register of large-scale topography, a municipality can include trees, but that part is optional. If they are in it, you have a location per tree and little more: no condition, no inspections, no history. It is a usable start, not a tree inventory.
Yes, if every row has coordinates and you know which system they are in, in the Netherlands usually RD or WGS84. A file with only street names or addresses is not accurate enough to find a tree again; then you go into the field for the location. IDA Bomen migrates your Excel list for you as part of onboarding, and after that every tree is on the map.
Accurate enough to tell it apart from the tree next to it without doubt. In an avenue with trees close together that is a stricter requirement than in a park. Check the points on a recent aerial photo: there you see at once whether a tree lies on its crown or on the neighbours' roof.
Preferably never again in one go. If every inspection, pruning round, felling and planting goes straight into the inventory, and people in the field report what is wrong, the inventory stays current through the ordinary work. A full resurvey is then only needed for areas where nobody has been for a long time. In IDA Bomen the crew records every action at the tree, and the tree manager approves new trees and deviations before they enter the register.
Read on
Municipal tree management: how a local authority runs it
Municipal tree management runs from policy and management plan to inspection, maintenance and records. The cycle, the roles and where it goes wrong.
6 min read
Tree management software: what it is and what to look for
Tree management software records your trees, inspections and maintenance on one map. What a tree management system does, and ten questions for any vendor.
7 min read
What is a tree safety inspection (BVC)?
A tree safety inspection (BVC in Dutch) is the visual check of a tree for defects that pose a danger. What you assess, record and follow up, and why.
4 min read


See your own tree inventory in IDA
Send us your tree inventory, as a shapefile, an Excel list or whatever you have, and we will show IDA on your own trees, from your own file to the approval of field work.
Used by