Skip to content
Platform

Every module of IDA, on one tree inventory.

Here you see per module what IDA does and who works with it, from the map with all your trees to the field app, the approval and the API. Every module works on the same tree register.

IDA · Dataset · Selectie
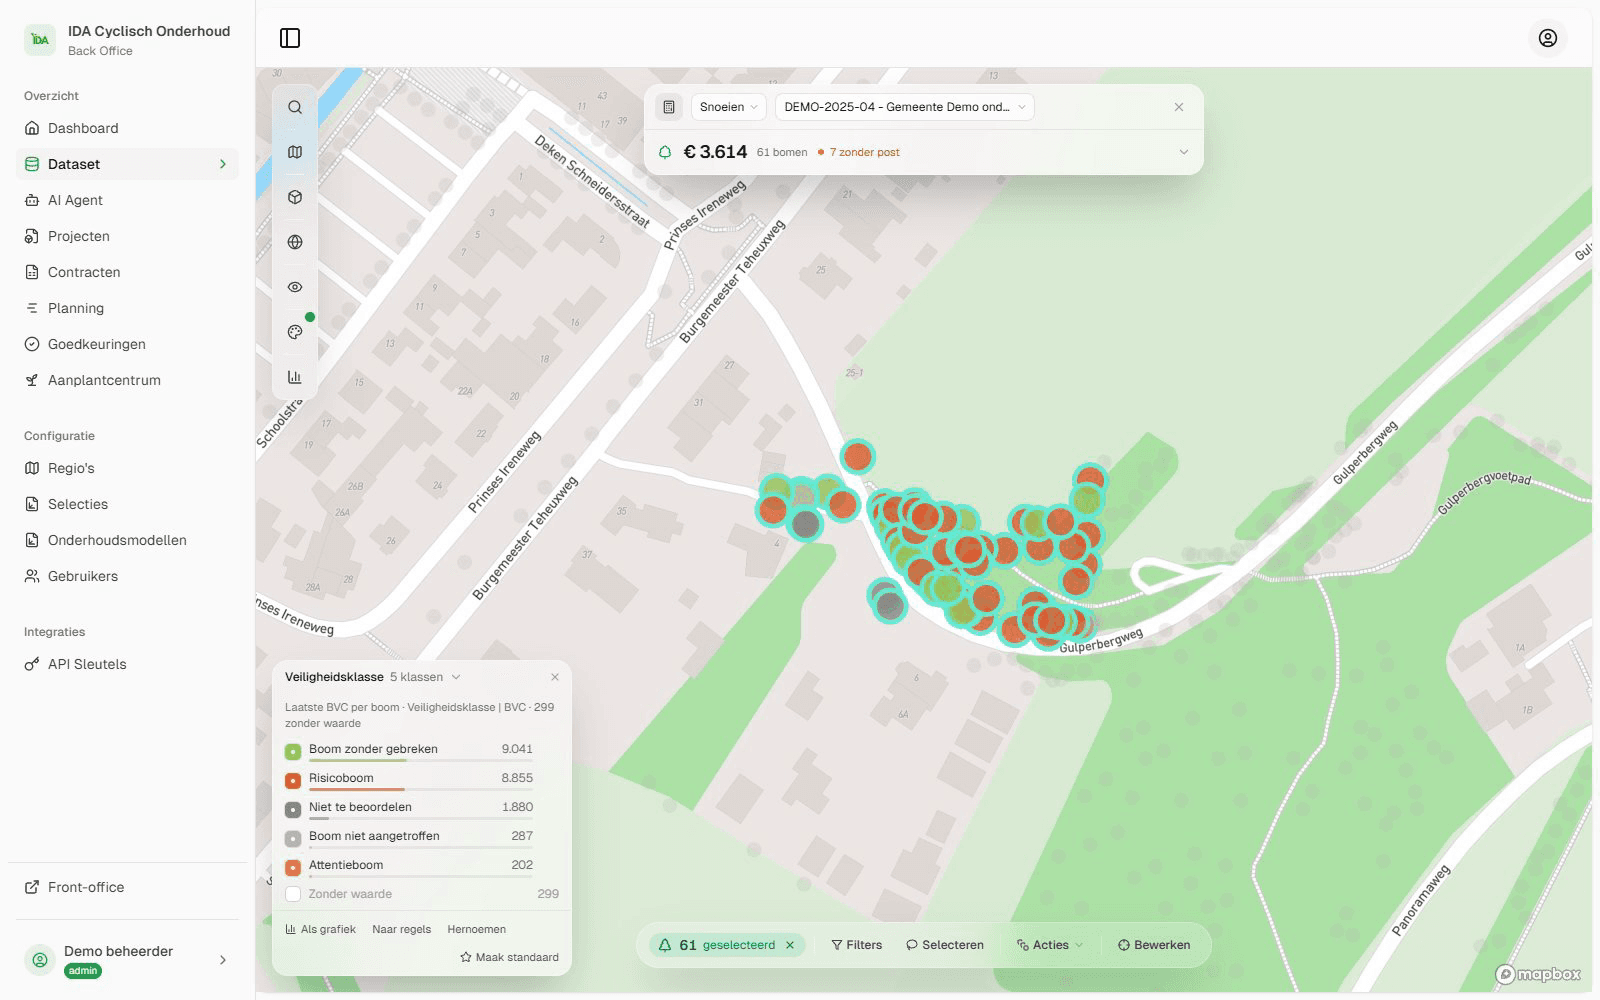
IDA's dataset on the map: a block of trees lassoed, with the cost estimate of the selection against the contract at the top.
Recording from the product, with demo data.

The map

Your tree register on one map: filtering, colouring, the file per tree and the figures that follow from it.

Dataset

The map with all your trees is where IDA starts. You filter, colour and select on the map, and turn a selection into a project, a cost estimate or an attribute. We migrate your tree register once. After that every module works on it.

  • Filter on any attribute, on date, region, risk and follow-up, and combine filters into exactly the group you are looking for.
  • Lasso a group of trees and set an attribute on all of them, make a cost estimate or a project, or archive them.
  • National map layers from PDOK, the Dutch geodata service, under your trees: aerial photo, cadastral parcels, the AHN height map, Natura 2000 and the soil map.
  • Zoom in and you see the measured crowns from the AHN and your trees in 3D.
  • We migrate your existing tree inventory for you, from your GIS, from Excel or from your current system. It is part of the onboarding.

Used by Admin and beheerder (manager), every day.

IDA · Dataset · Filters
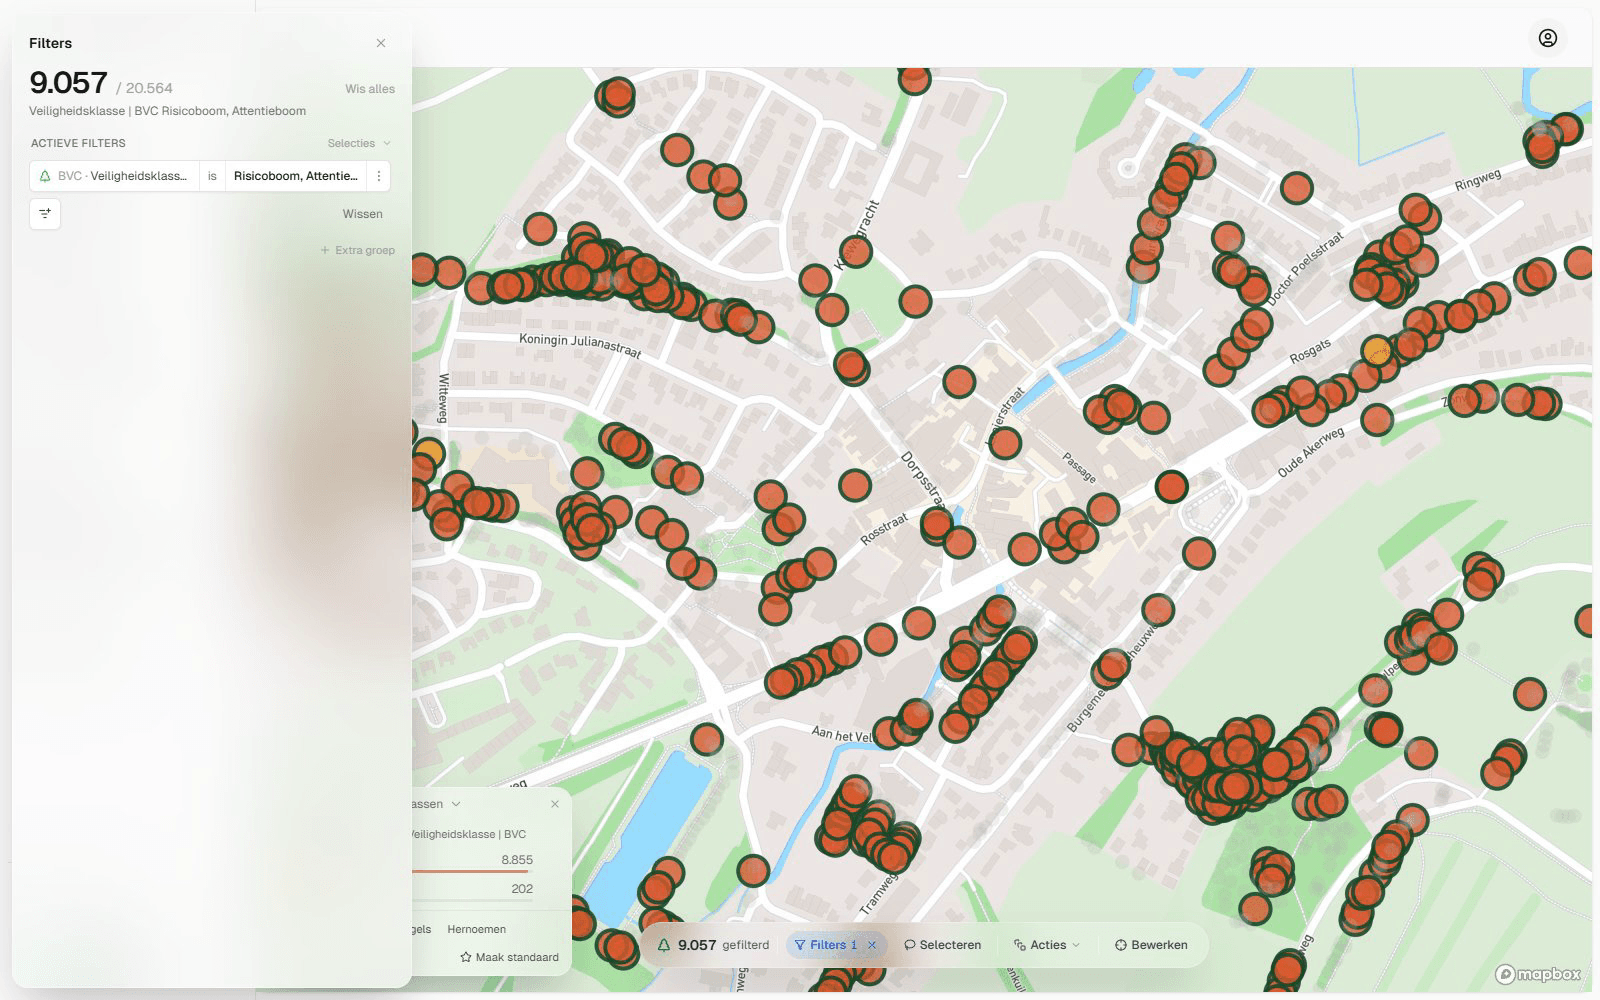
IDA's dataset on the aerial photo with the filter panel open: one filter as a sentence, BVC · Veiligheidsklasse is Risicoboom, Attentieboom, the count 9,057 of 20,564 trees and the toolbar with Filters 1 at the bottom.

Tree file (boomdossier)

Open a tree on the map and you see photos, the current values per BVC group and, under each value, where it came from. The file supports your duty of care, for the manager and for anyone who asks about it later.

  • Under each value you see where it came from: an import, a mutation or an approved field observation, with who and when.
  • Every attribute keeps its earlier values.
  • A timeline with everything that has been done to the tree, with photos.
  • The timeline as a PDF, with photos and approved deviations.

Used by Admin and beheerder (manager).

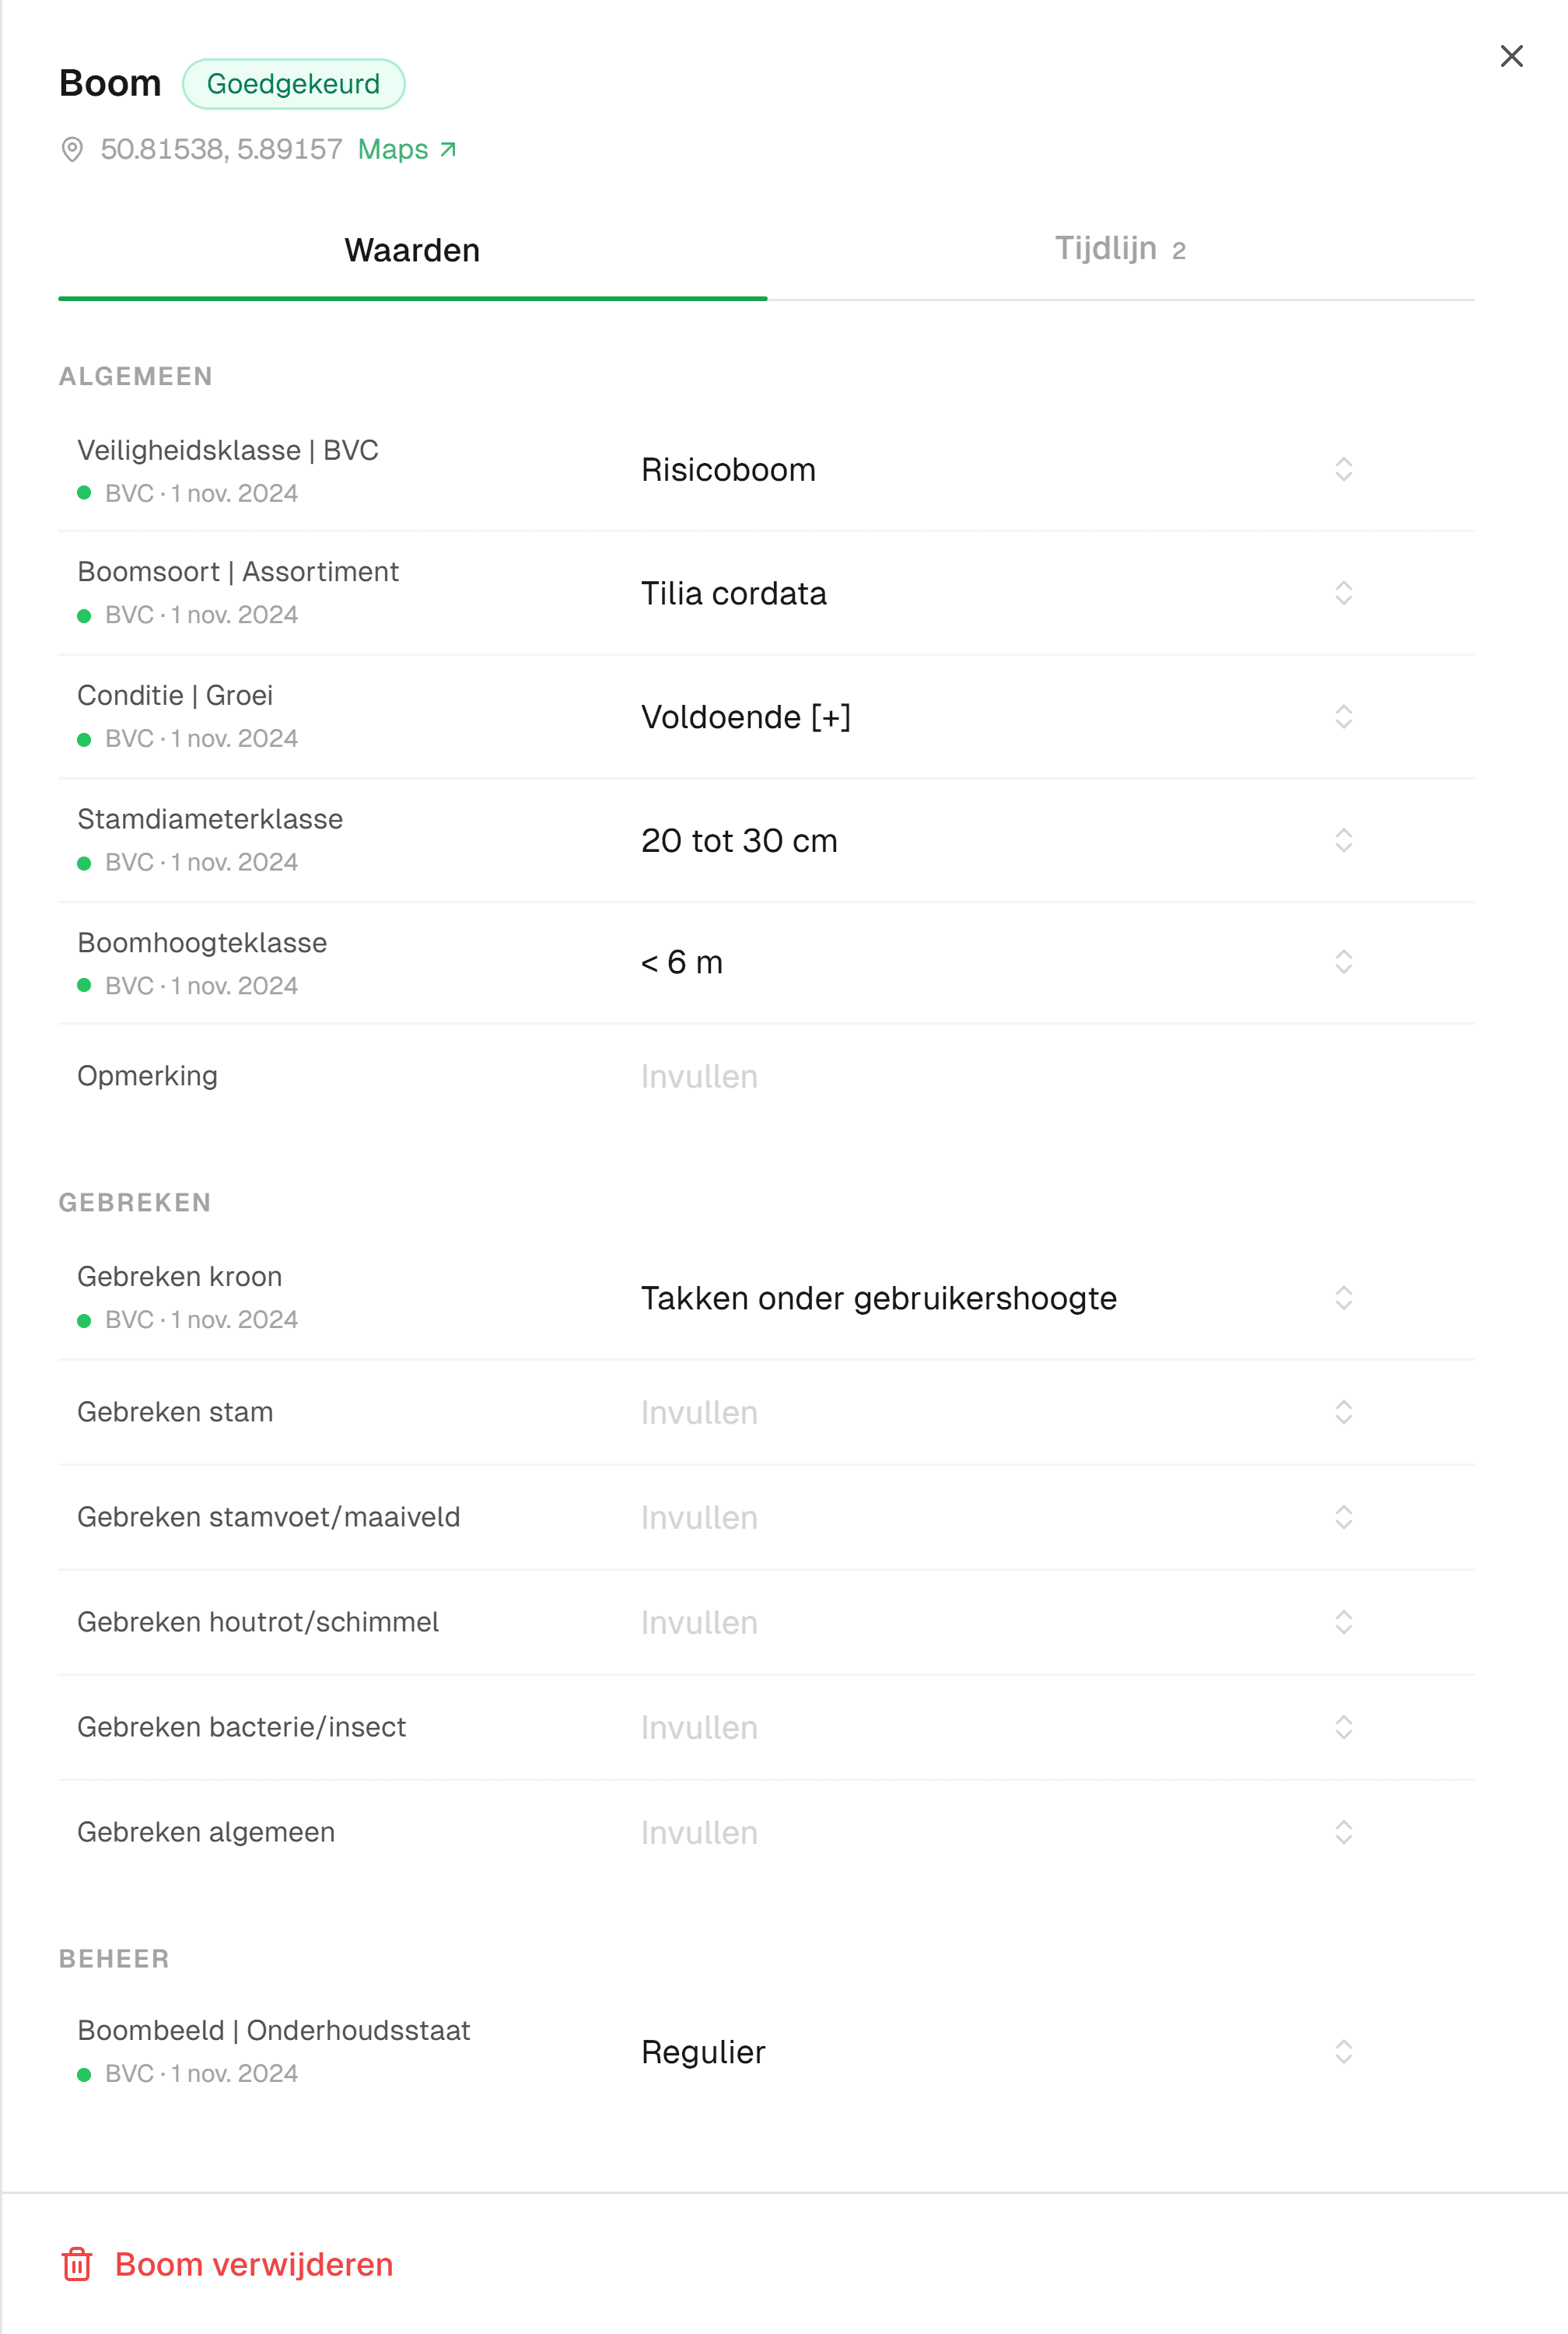
The tree record on the Values tab: an approved tree with coordinates, the groups General, Defects and Management from the BVC model, and under each value its provenance, here BVC, 1 November 2024.

Visualisations and selections

A selection is a saved filter; a visualisation decides how the map is coloured. Together they make sure everyone looks at the same groups of trees: on the map, in projects and on the dashboard.

  • You reuse a selection on the map, in a project and as a chart on the dashboard.
  • A selection on 'the past three years' stays current by itself.
  • Colour the map by value, or in classes you define yourself.
  • In the legend you single out a class, or turn it into a chart.
  • Draw your own regions on the map and use them in filters and charts.

Used by Admin and beheerder (manager).

IDA · Visualisaties
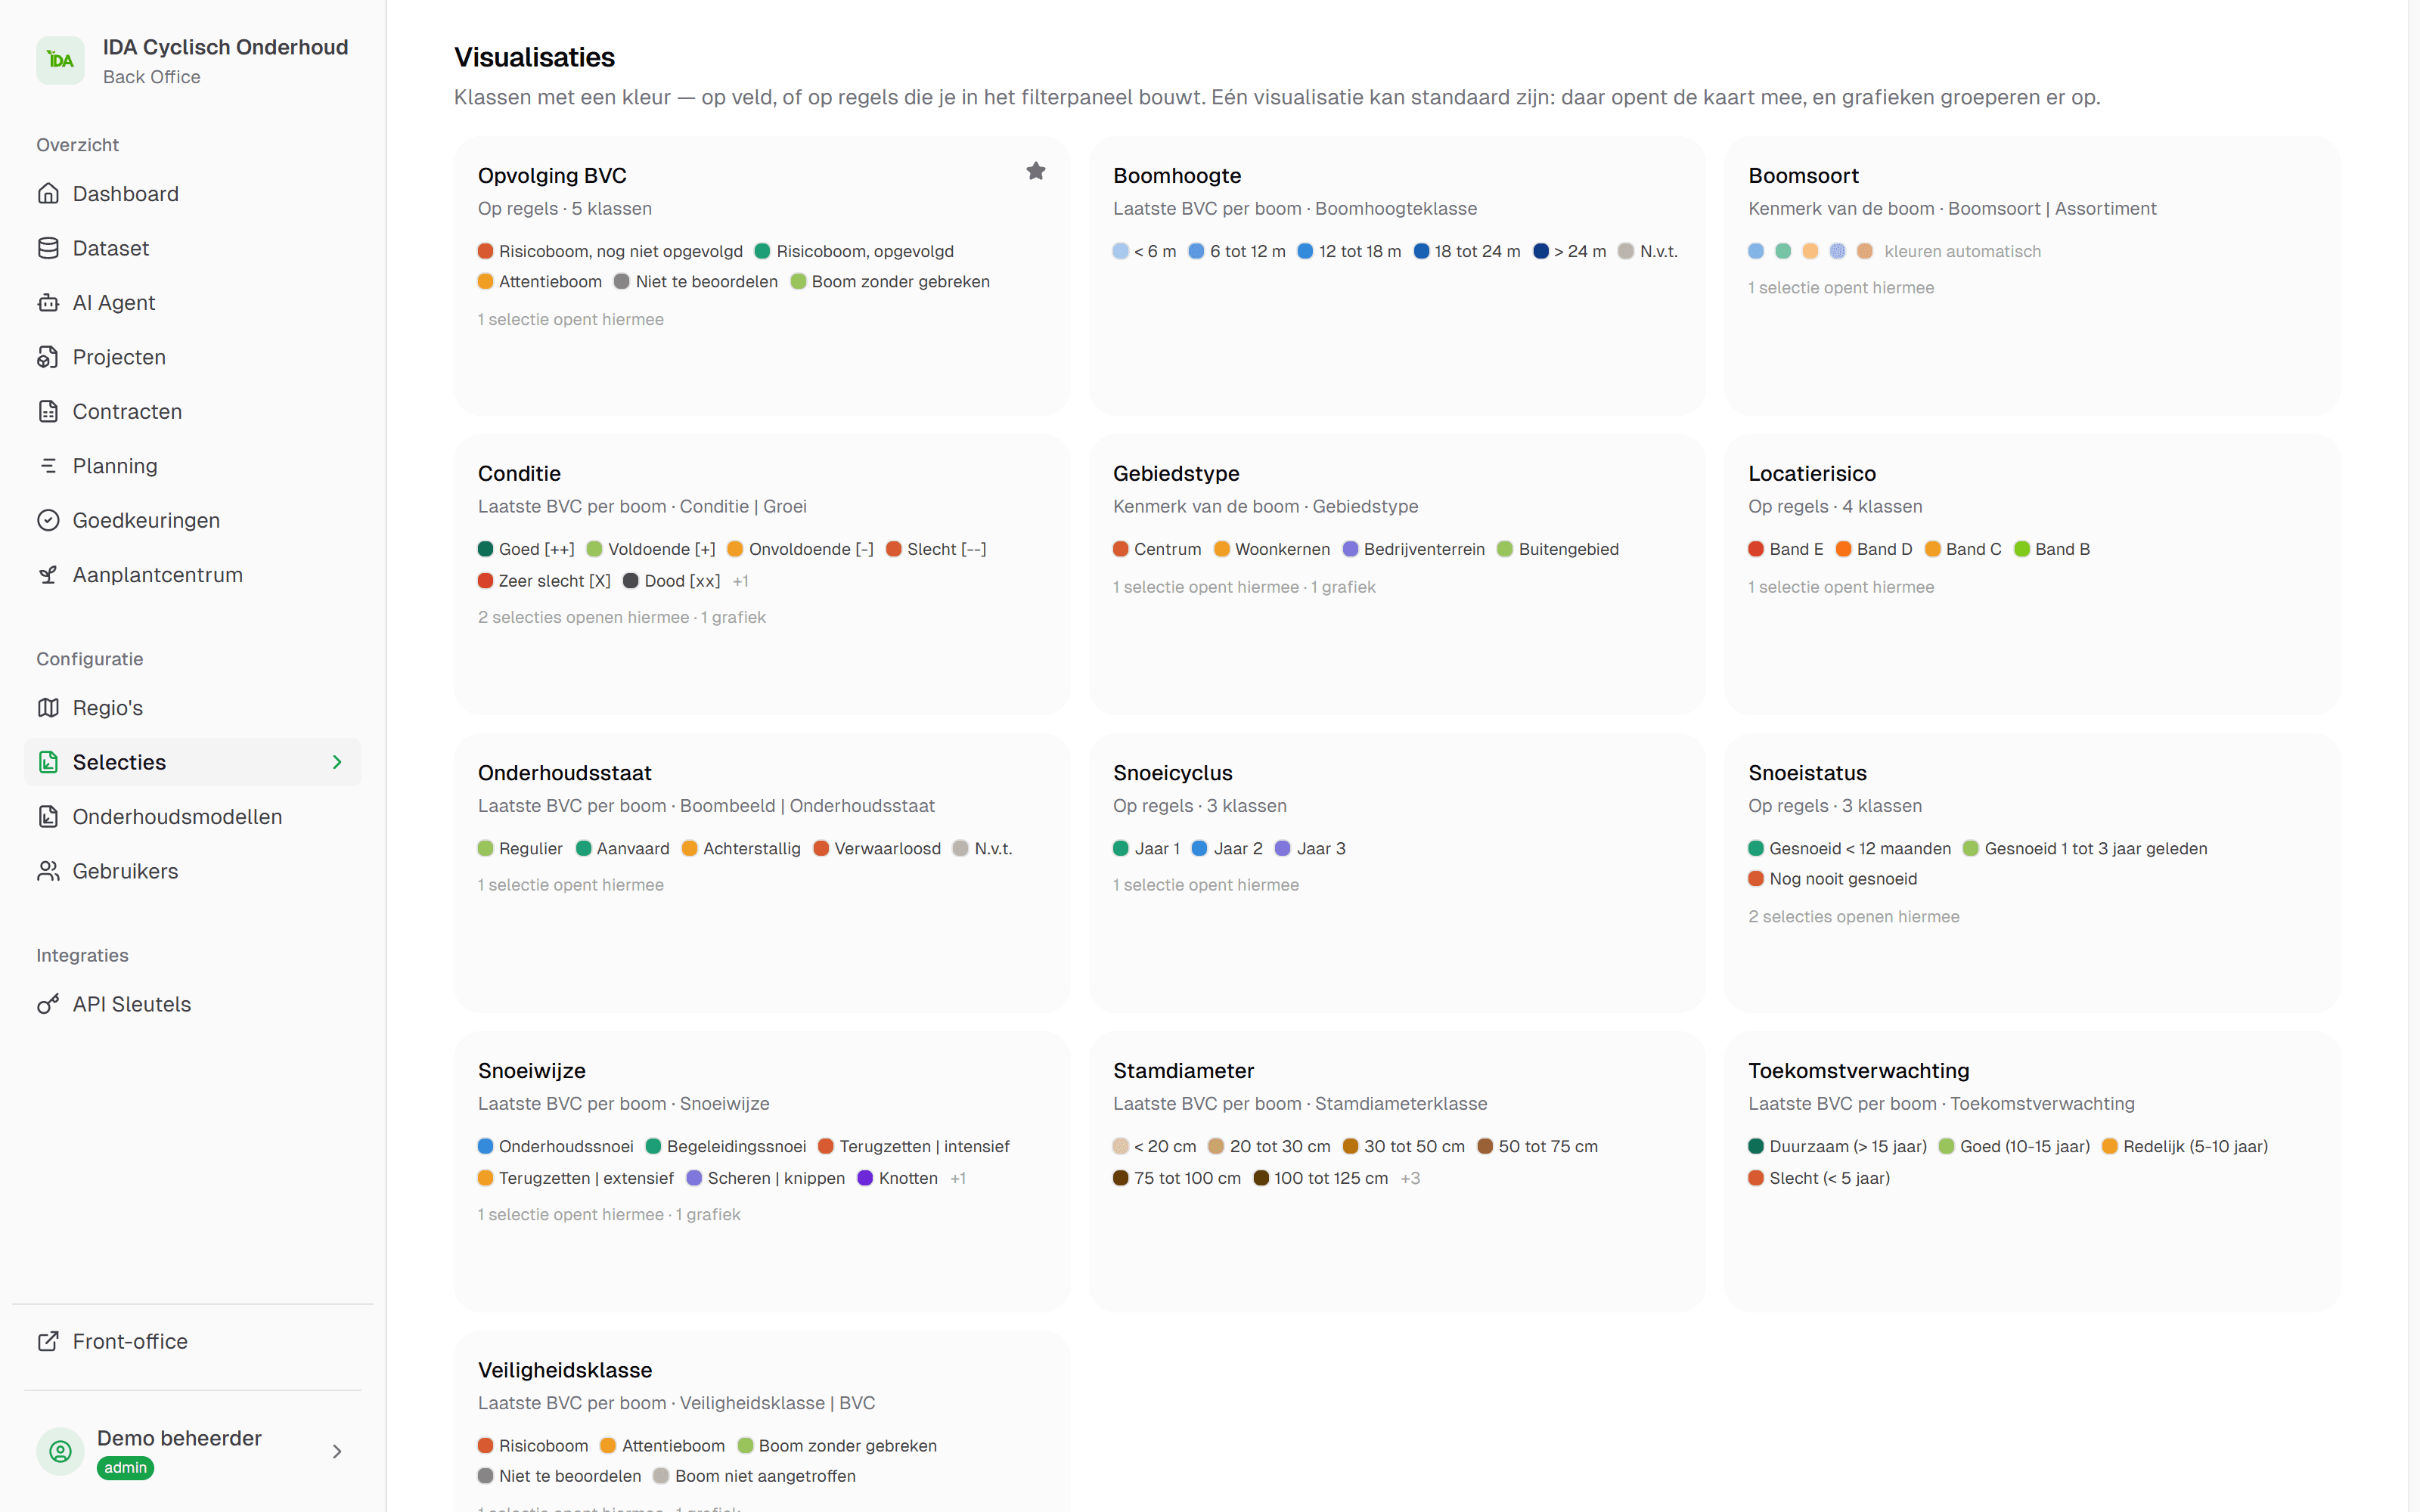
The visualisations in IDA: per visualisation its classes with their colours, by field or by rules, and which one is the default.

Risk prioritisation

Every tree gets a risk score, based on what stands within its falling range: people, roads and buildings. IDA maps those scores, so you see where to go first. Available as a module.

  • A score from 0 to 100 per tree, in classes A to E.
  • Buildings and roads come from the Dutch national registers.
  • On the map a column per tree: the higher the column, the higher the score.
  • Calculate the whole tree register in one go and filter the map on risk class.
  • The score sits next to your inspector's safety class (Veiligheidsklasse).

Used by Admin and beheerder (manager), when prioritising work and budget.

IDA · Dataset · Risicoanalyse
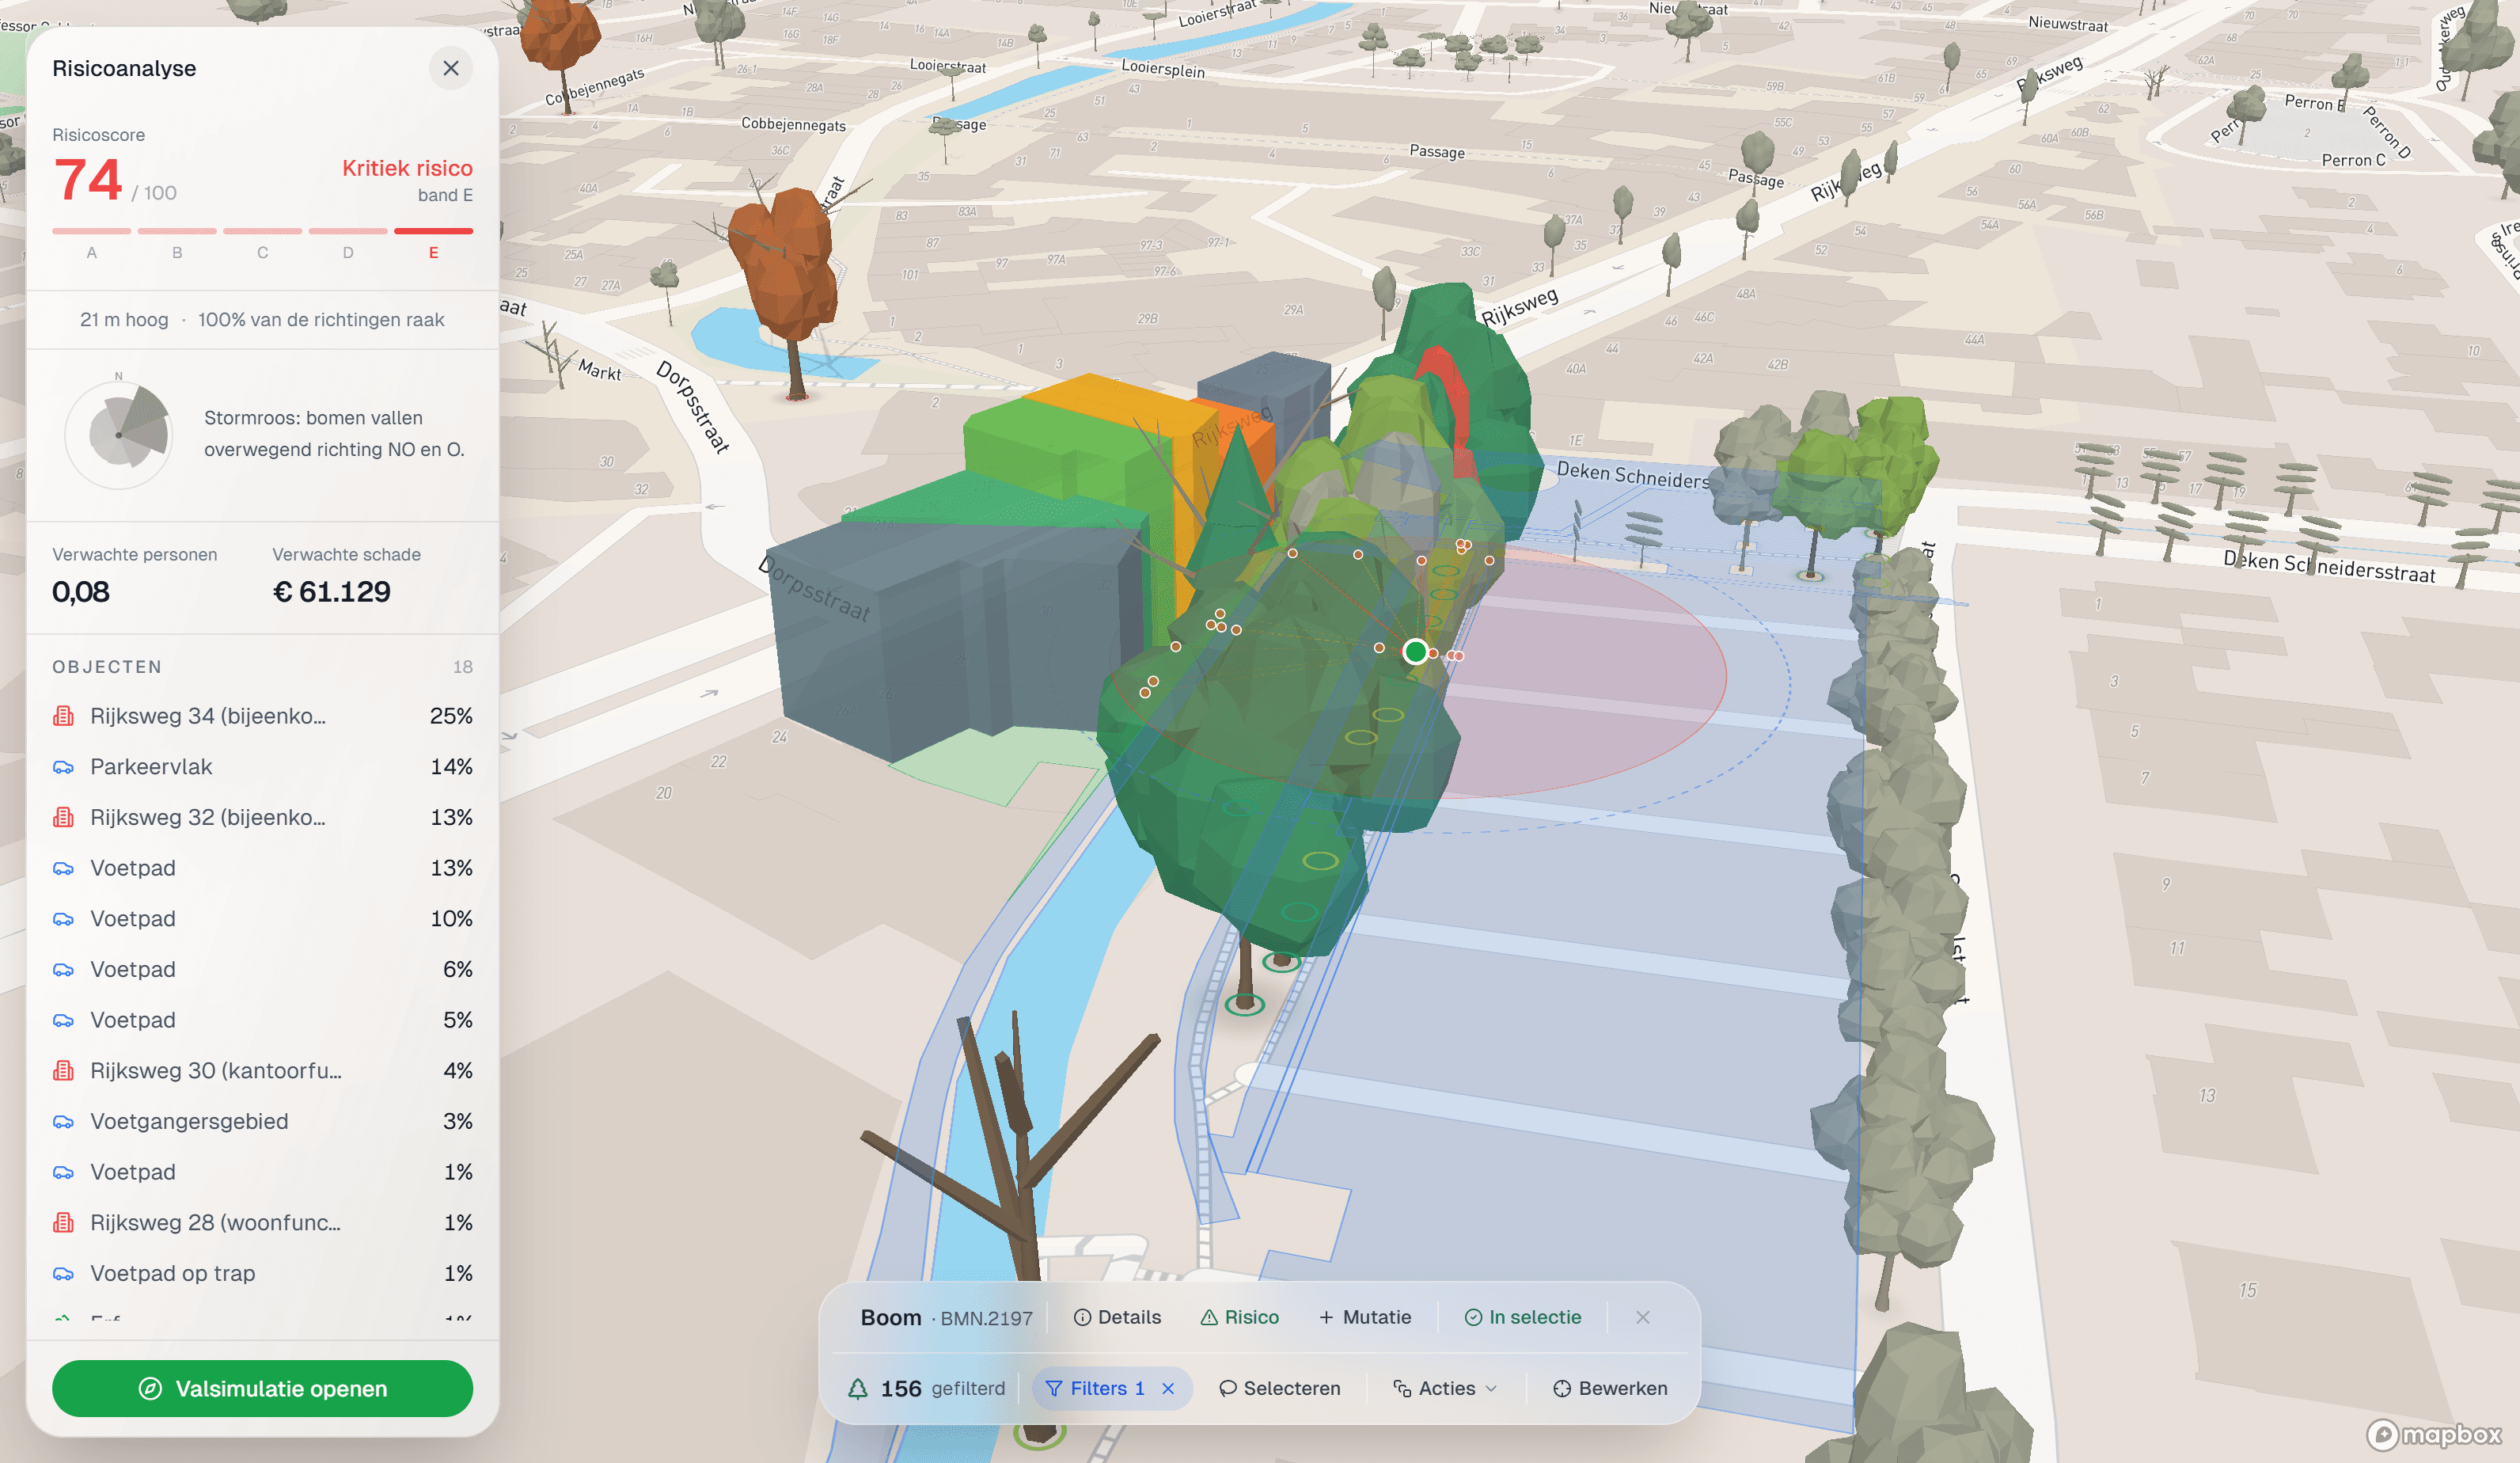
The risk analysis of one tree in IDA, in 3D: the fall zone over the street and the buildings around it, with the Risicoanalyse panel on the left: score 74 out of 100 in band E, the storm rose, expected persons and expected damage, and the objects in the fall zone with their share.

Crown volume

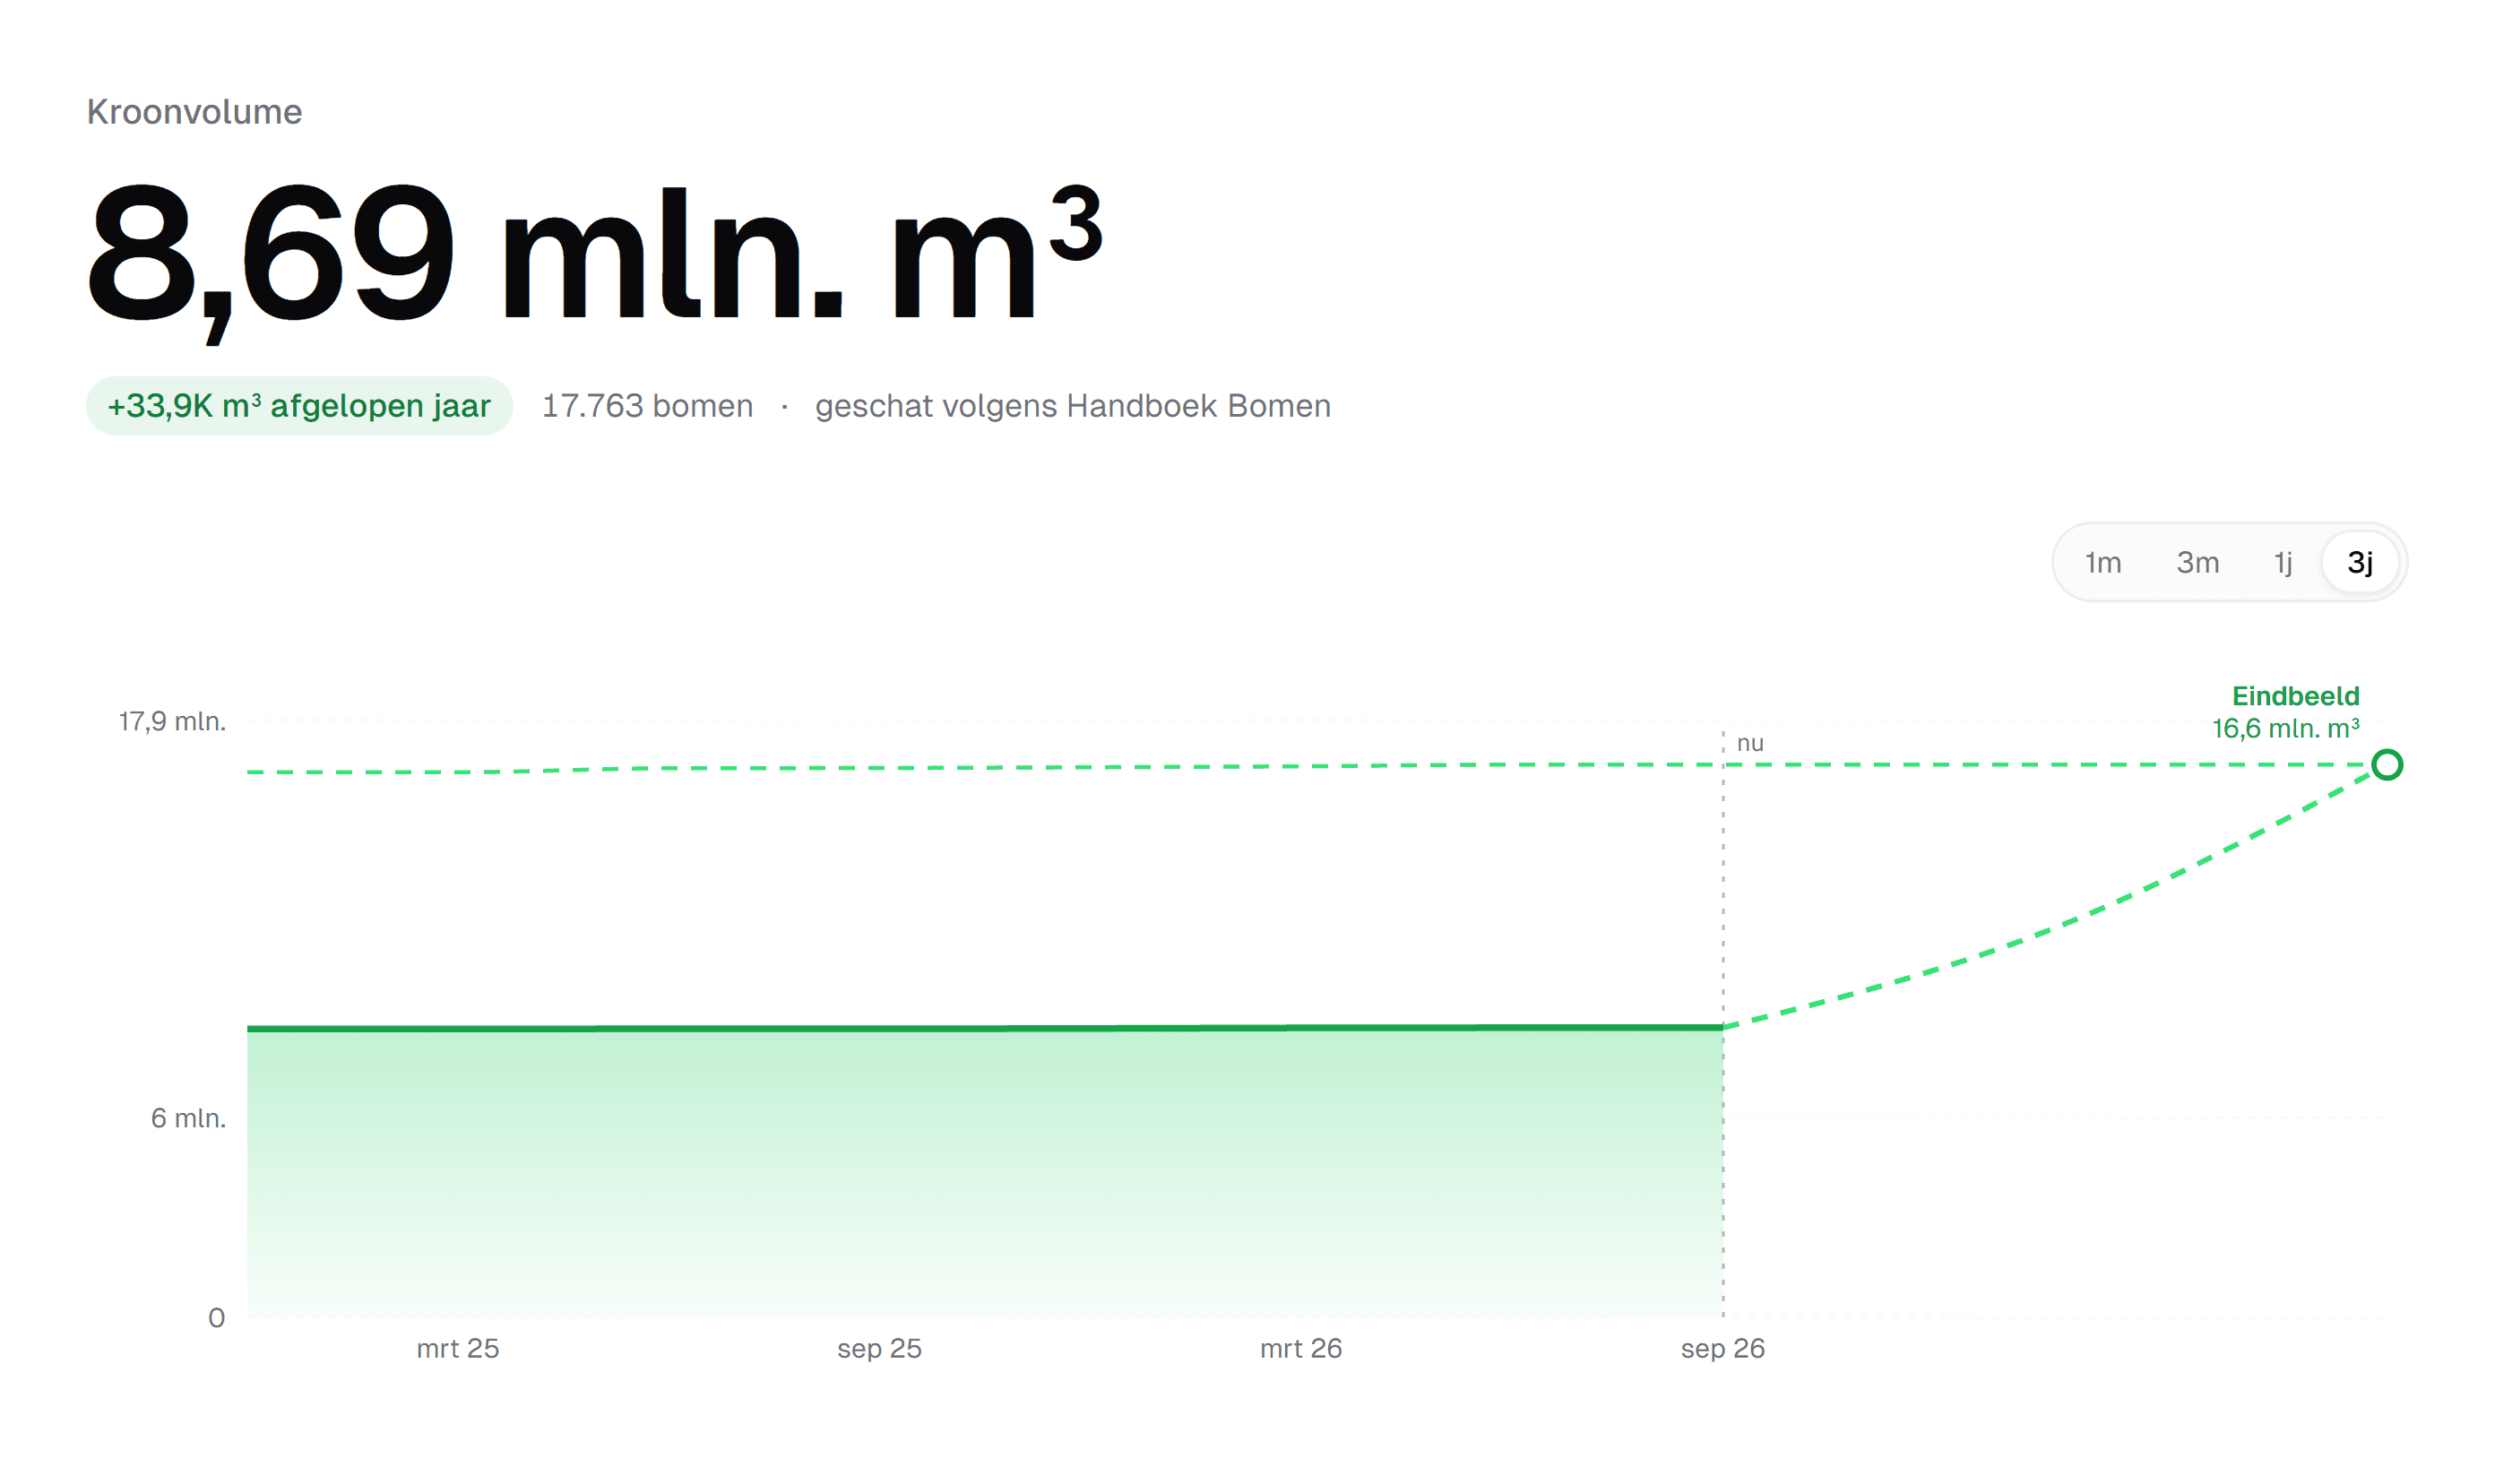
IDA calculates the tree crown volume of your tree register following Handboek Bomen, checked against the height measurements of the AHN, the Dutch national height model. A substantiated figure for policy and reporting.

  • Calculated from the data that is already in your tree register.
  • The total volume and how it develops over one month to three years.
  • How much of the end state already stands today.
  • Distribution by height class, growth form and condition.
  • Measured and estimated crowns side by side, so you see how well the figure holds.

Used by Admin and beheerder (manager), for policy and reporting.

IDA · Kroonvolume
The head of IDA's crown volume dashboard: total tree crown volume of 8.69 million cubic metres, the increase over the past year, the number of trees and a trend chart with the dotted line towards the target end state.

The work

From selection to approved mutation: projects, the field app, the approval and the planning around it.

Projects

In a project you set out work: a group of trees, the form that goes with it and who may work on it. The manager creates it from a selection. A contractor or your own field crew sees the projects assigned to them.

  • Types: BVC, Snoeien (pruning), Nazorg (aftercare), Kappen (felling), Aanplanten (planting) and Custom.
  • Werk bij (update) fetches the selection again. Trees that have already been worked on stay in the project.
  • You decide per person or per organisation who views and who edits.
  • Progress at a glance: what was done today, by whom, and when the project is expected to finish.
  • Export a project to the common GIS and Excel formats.

Used by Admin and beheerder (manager); field workers work on them in the frontoffice.

IDA · Project
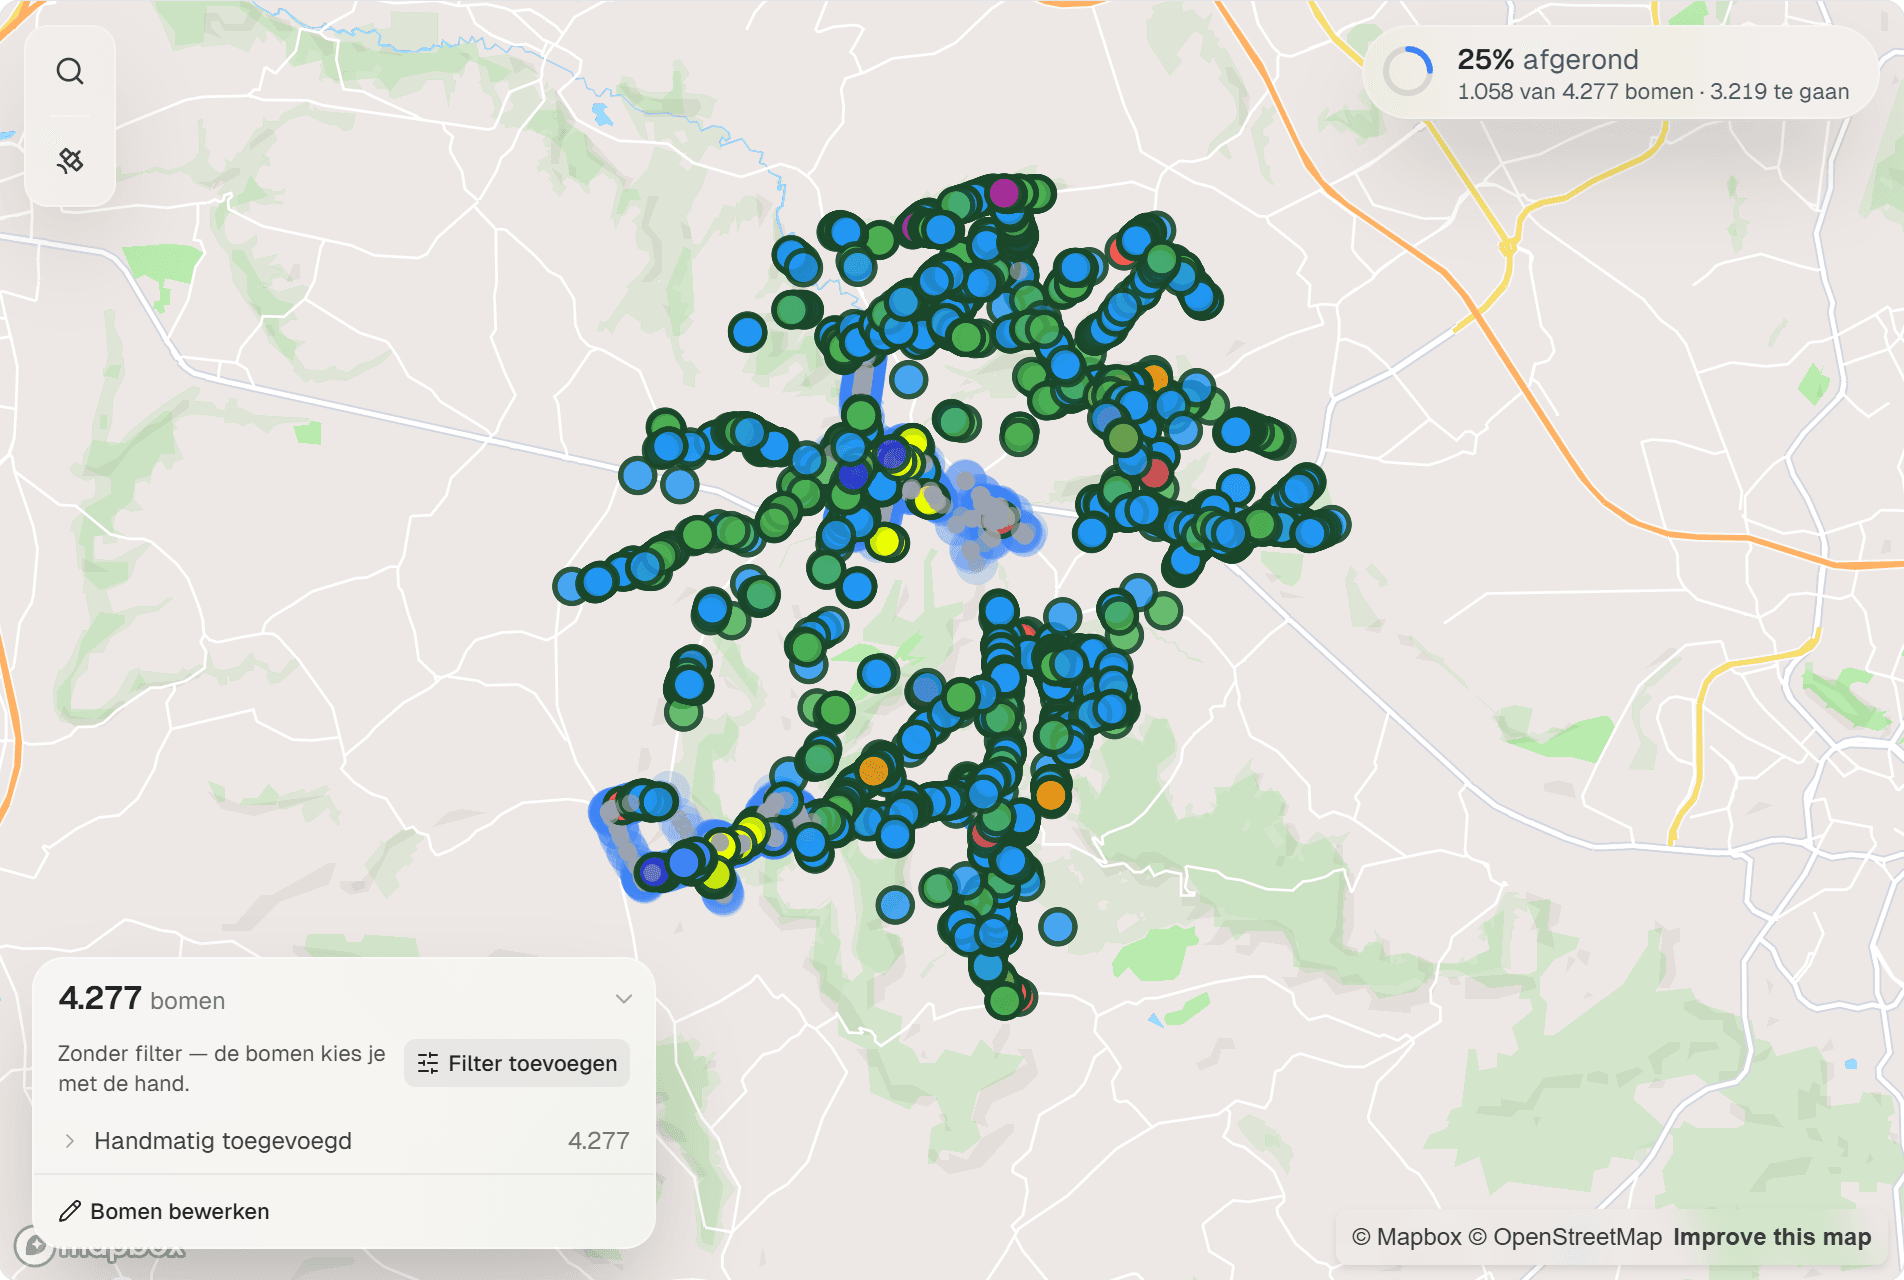
The project map in IDA: the trees of a project on the map, with the progress ring and the number of completed trees top right.
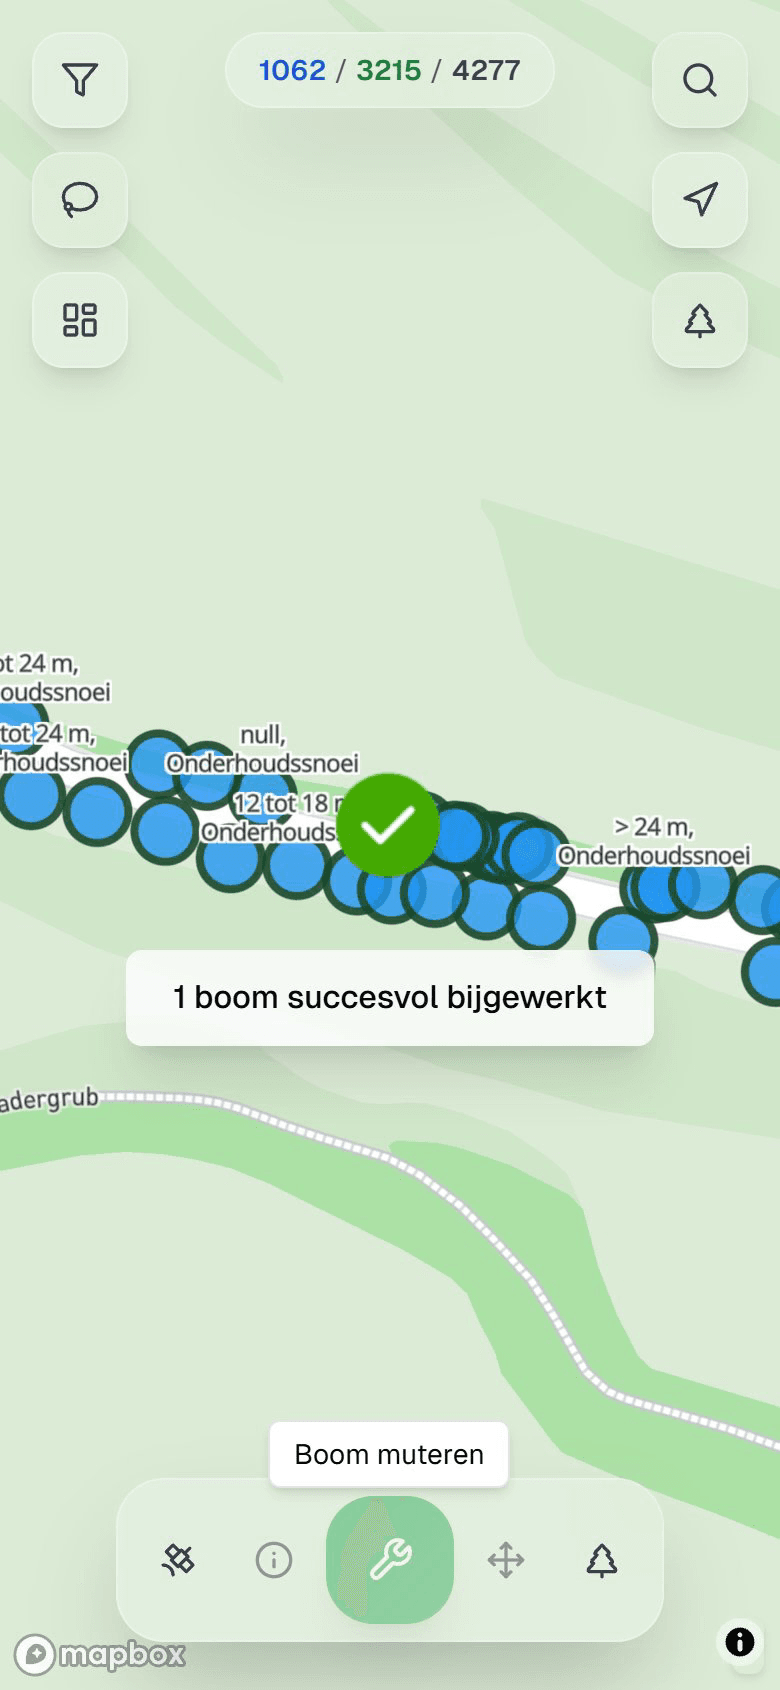
The frontoffice app on a phone: the project map with the counter of completed trees and buttons for filter, lasso and search.

Frontoffice

The field app for phone and tablet, in the browser and with no install. Field workers and researchers open their project, tap a tree and record what they see and do.

  • The project map full screen, with your own position, filters and search.
  • The project's form, with the previous values already filled in and photos straight from the camera.
  • Copy a mutation to other trees and set a status, such as Wacht op vergunning (waiting for permit) or Uitstel broedseizoen (postponed for the breeding season).
  • Report a deviation from the BVC register, with mandatory photos.
  • In an inventory, add, move or delete trees, and confirm planting.

Used by Uitvoering (field work) and Onderzoek (research), from your own crew or the contractor's.

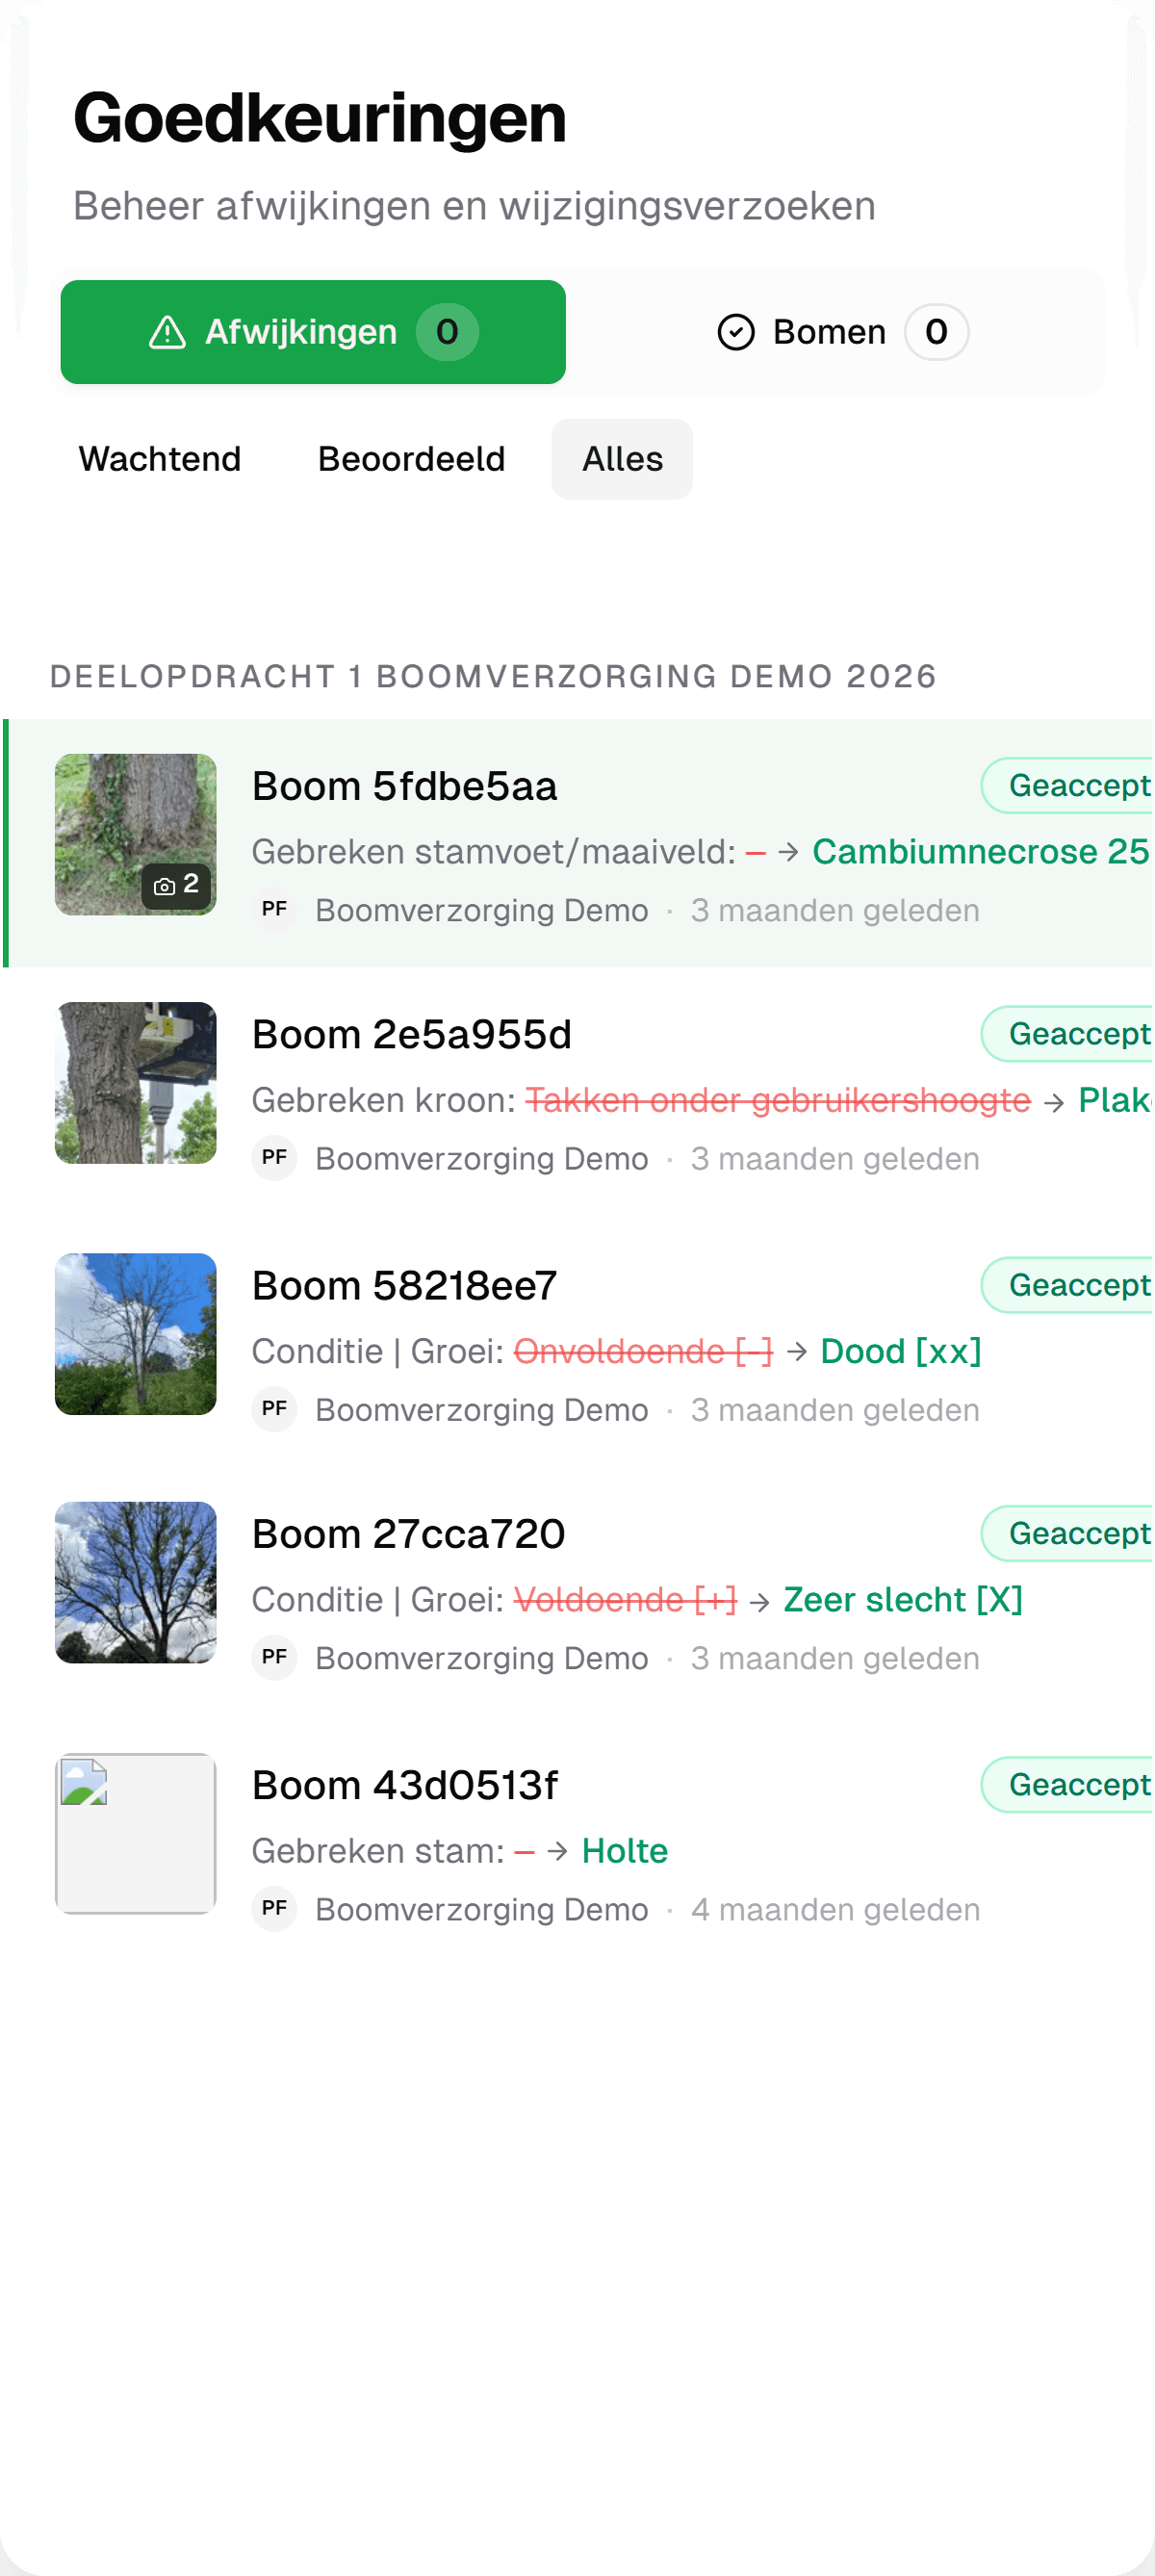
The Approvals queue in IDA: per deviation the photo from the field, the old value struck through and the new one in green, with who and when.

Approvals

New trees and deviations from the field enter the tree register after the manager has approved them. That happens in two queues on the map.

  • You approve new trees from an inventory one by one or all at once, per project.
  • Every deviation comes with proof photos, the reporter and their organisation.
  • Per field you see what was recorded and what was observed in the field.
  • After approval the new value is in the tree file and the price of the tree is right again.

Used by Admin and beheerder (manager).

IDA · Planning
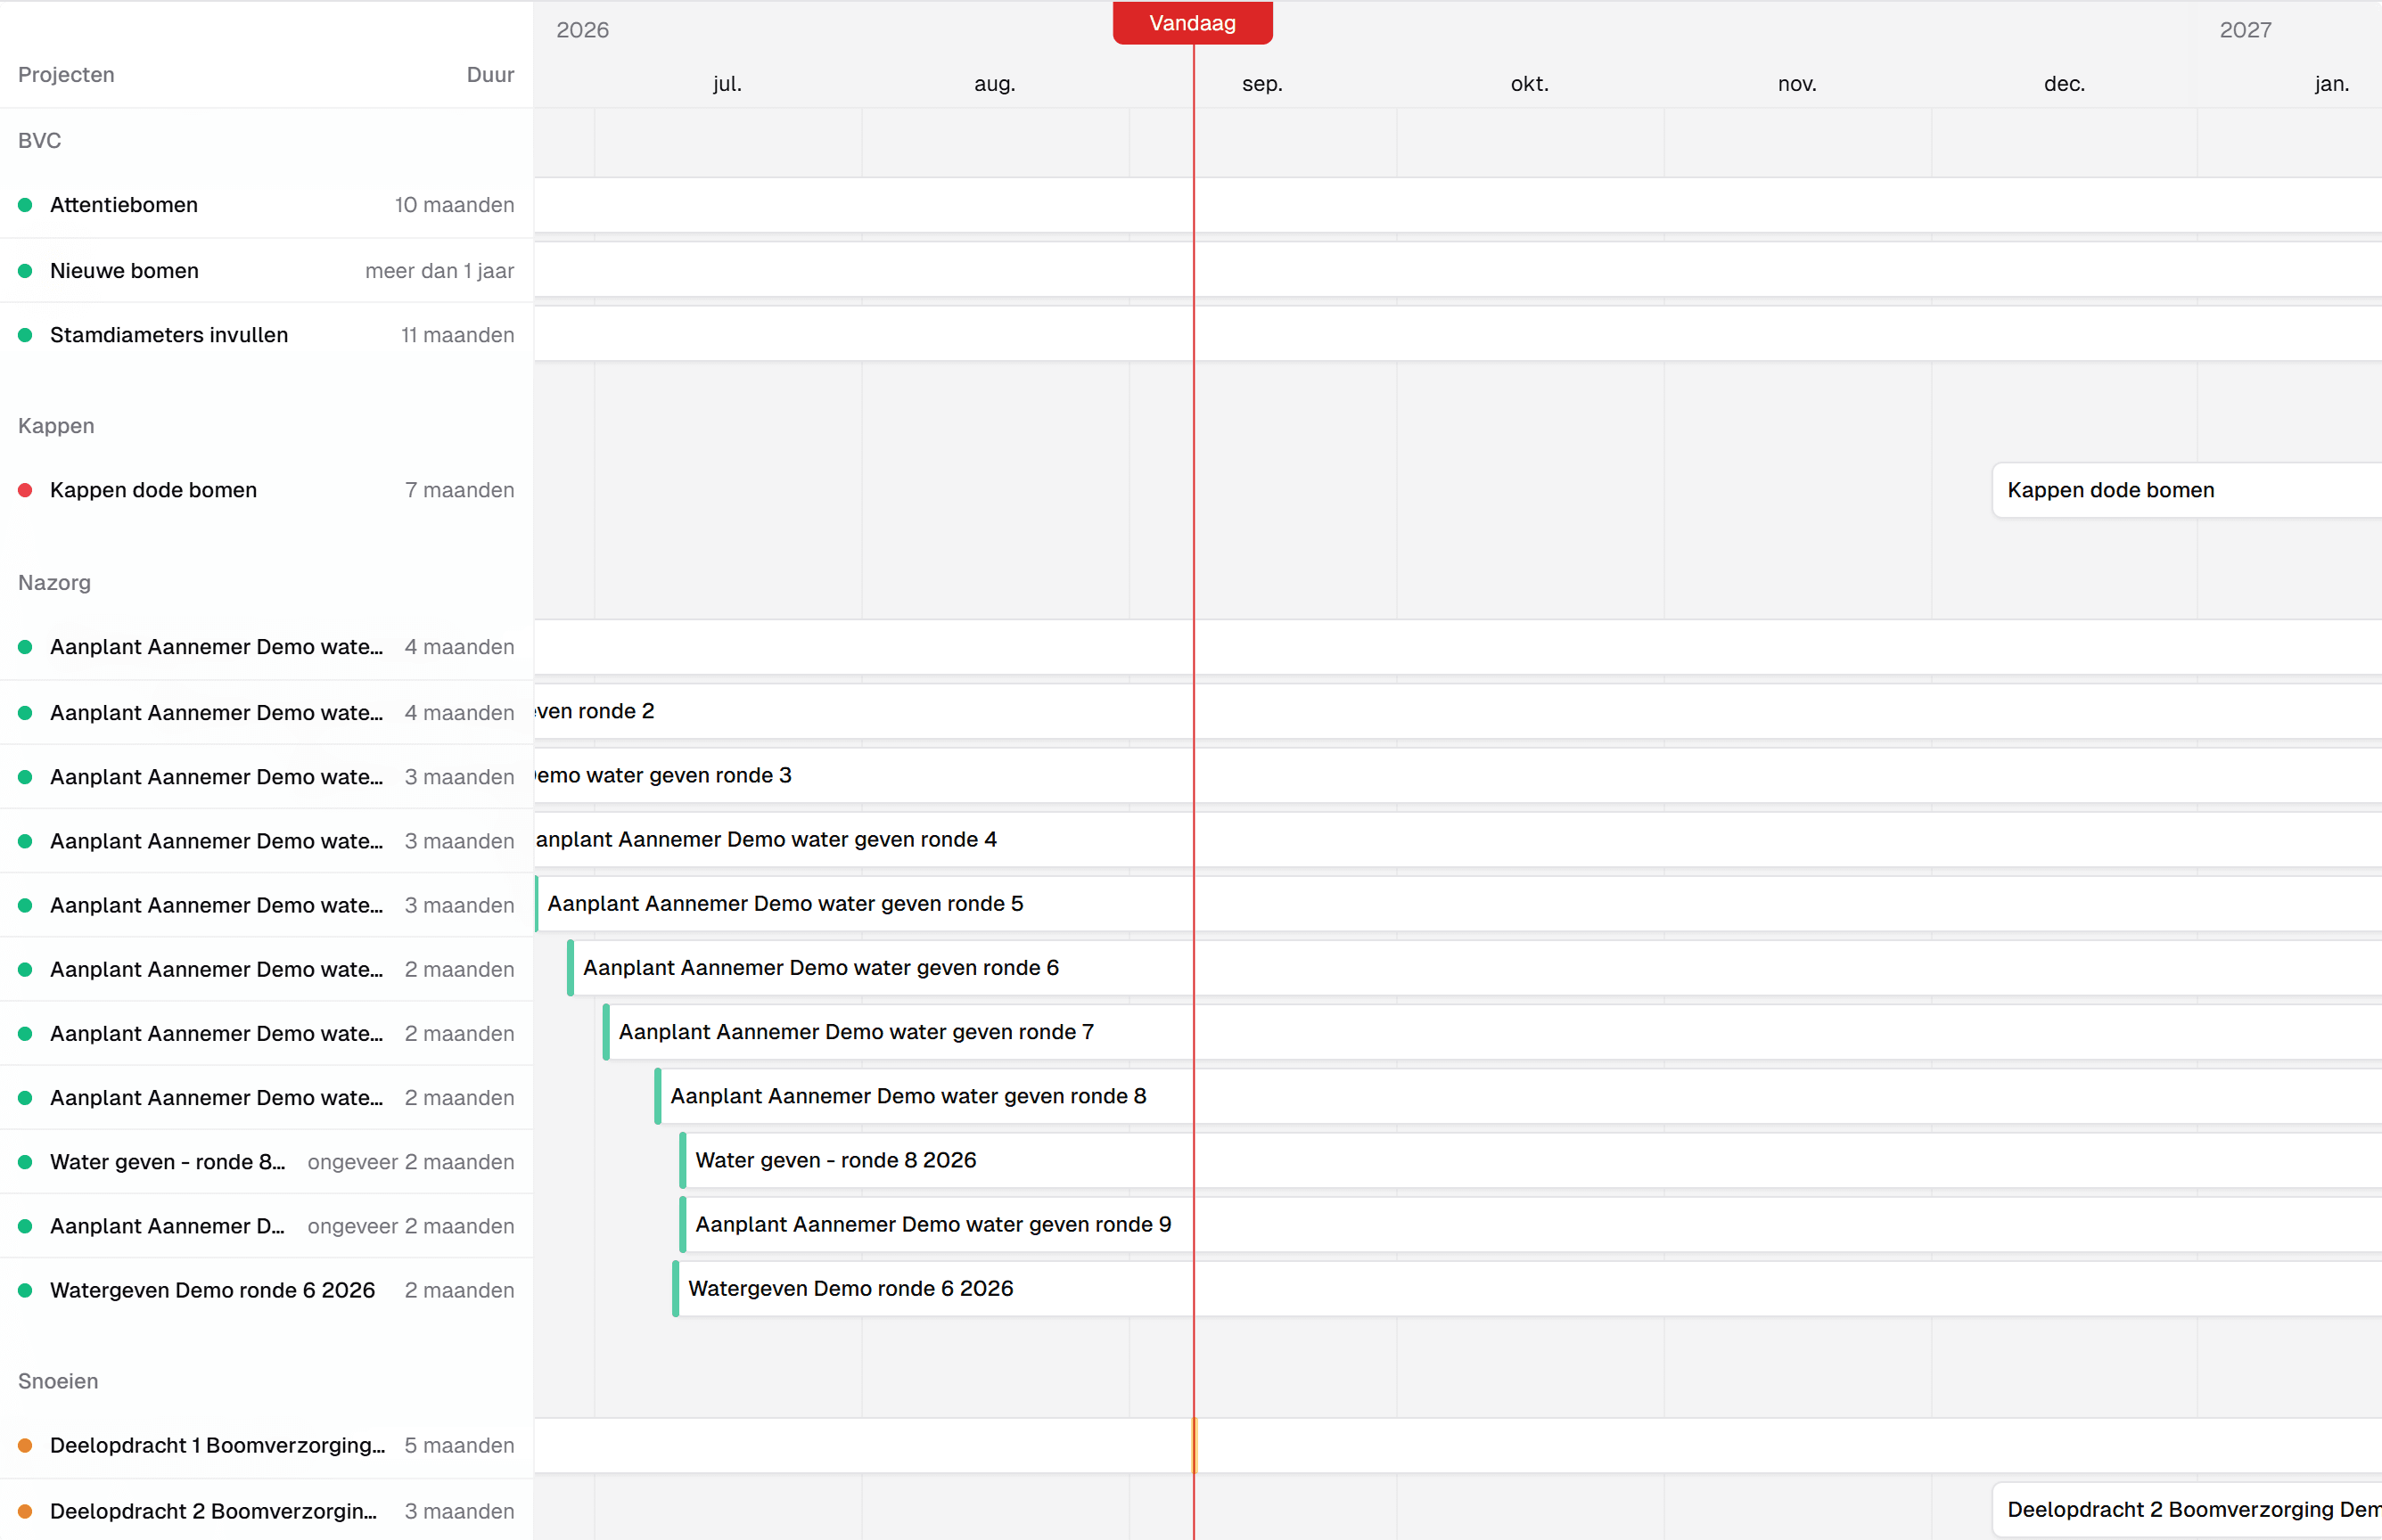
Project planning in IDA: a Gantt with projects per type, the months above and the red line on today.

Planning

One timeline for all projects, grouped by type. You see what is running, what is behind and which organisation is working on it.

  • A Gantt with expected and actual dates.
  • A colour shows what is on schedule and how many days something is behind.
  • With every project you see which organisations are working on it.
  • You move dates by dragging.

Used by Admin and beheerder (manager).

IDA · Aanplantcentrum
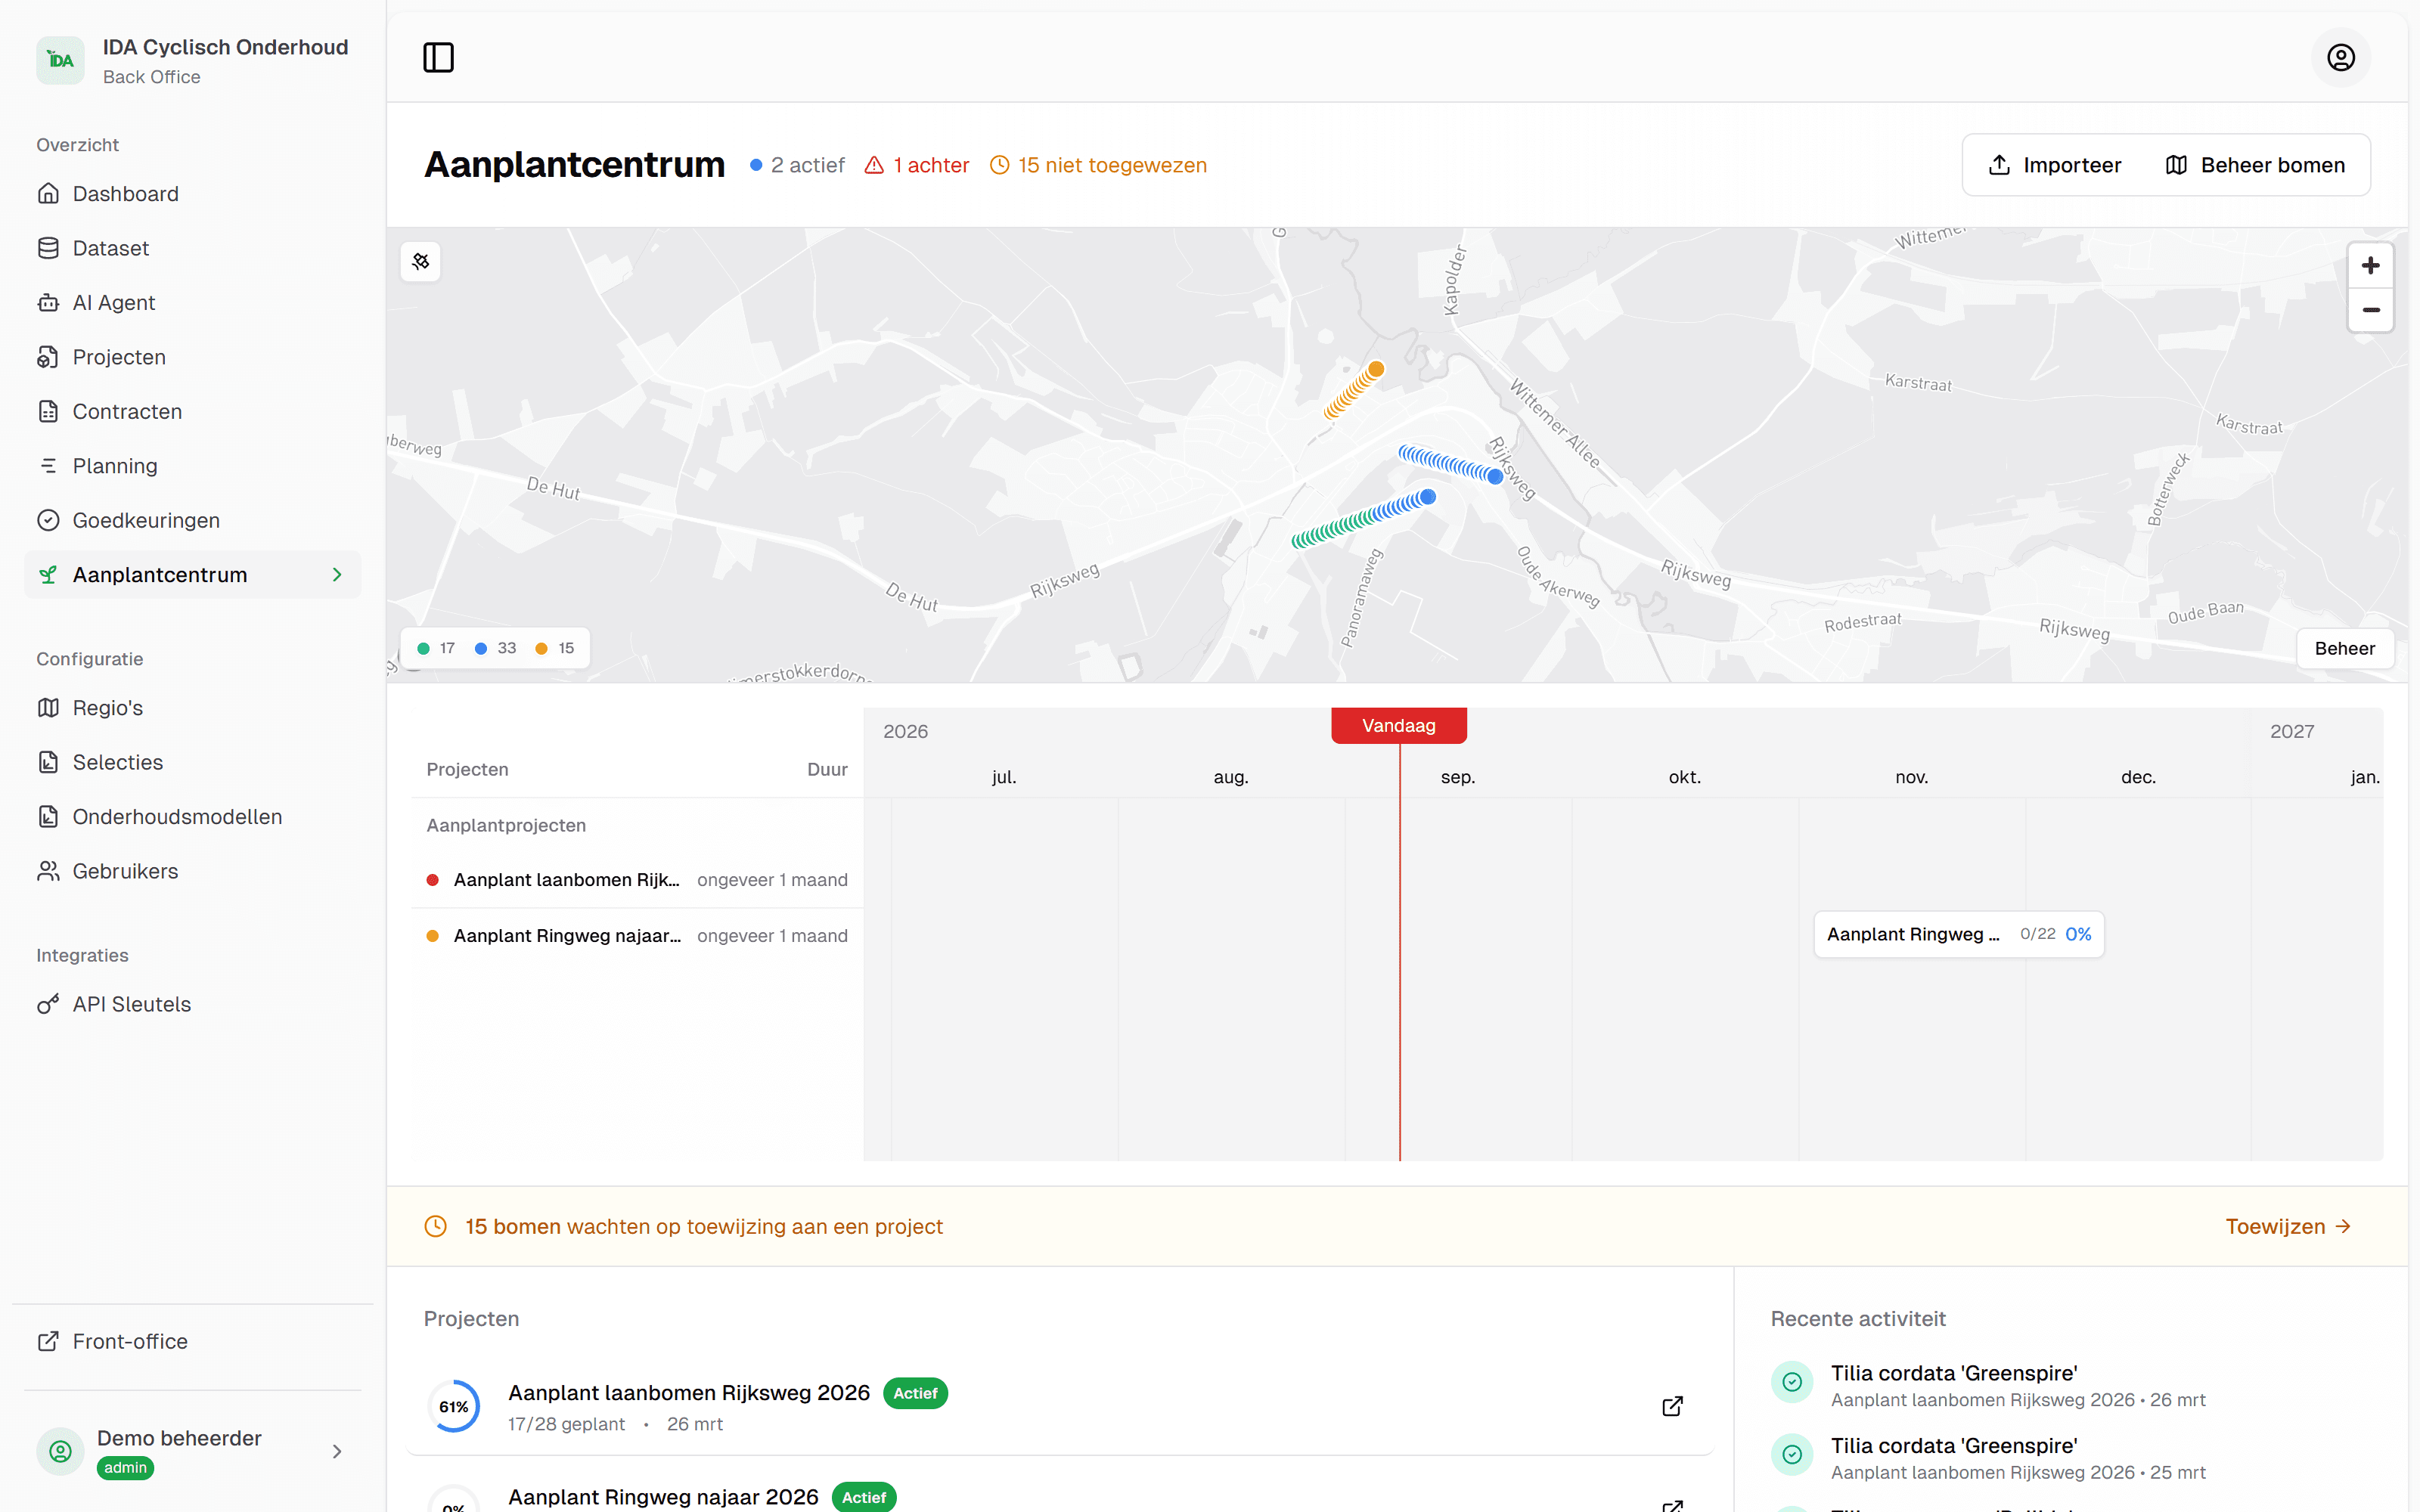
The Planting centre in IDA: the counts active, overdue and unassigned, the planting projects on the map and the timeline below.

Planting centre

New planting starts as a concept tree. You assign concept trees to a planting project; once they are confirmed as planted in the field, they become real trees in your tree register.

  • Concept trees from a file, from coordinates or by clicking on the map.
  • An overview with the counts active, overdue and unassigned.
  • A timeline of the planting projects.
  • After confirmation the new tree also gets its crown measurement.

Used by Admin and beheerder (manager); confirming happens in the frontoffice.

Setup and integrations

Contracts, forms and the API: this is how you fit IDA to your own way of working and connect it to other systems.

Contracts

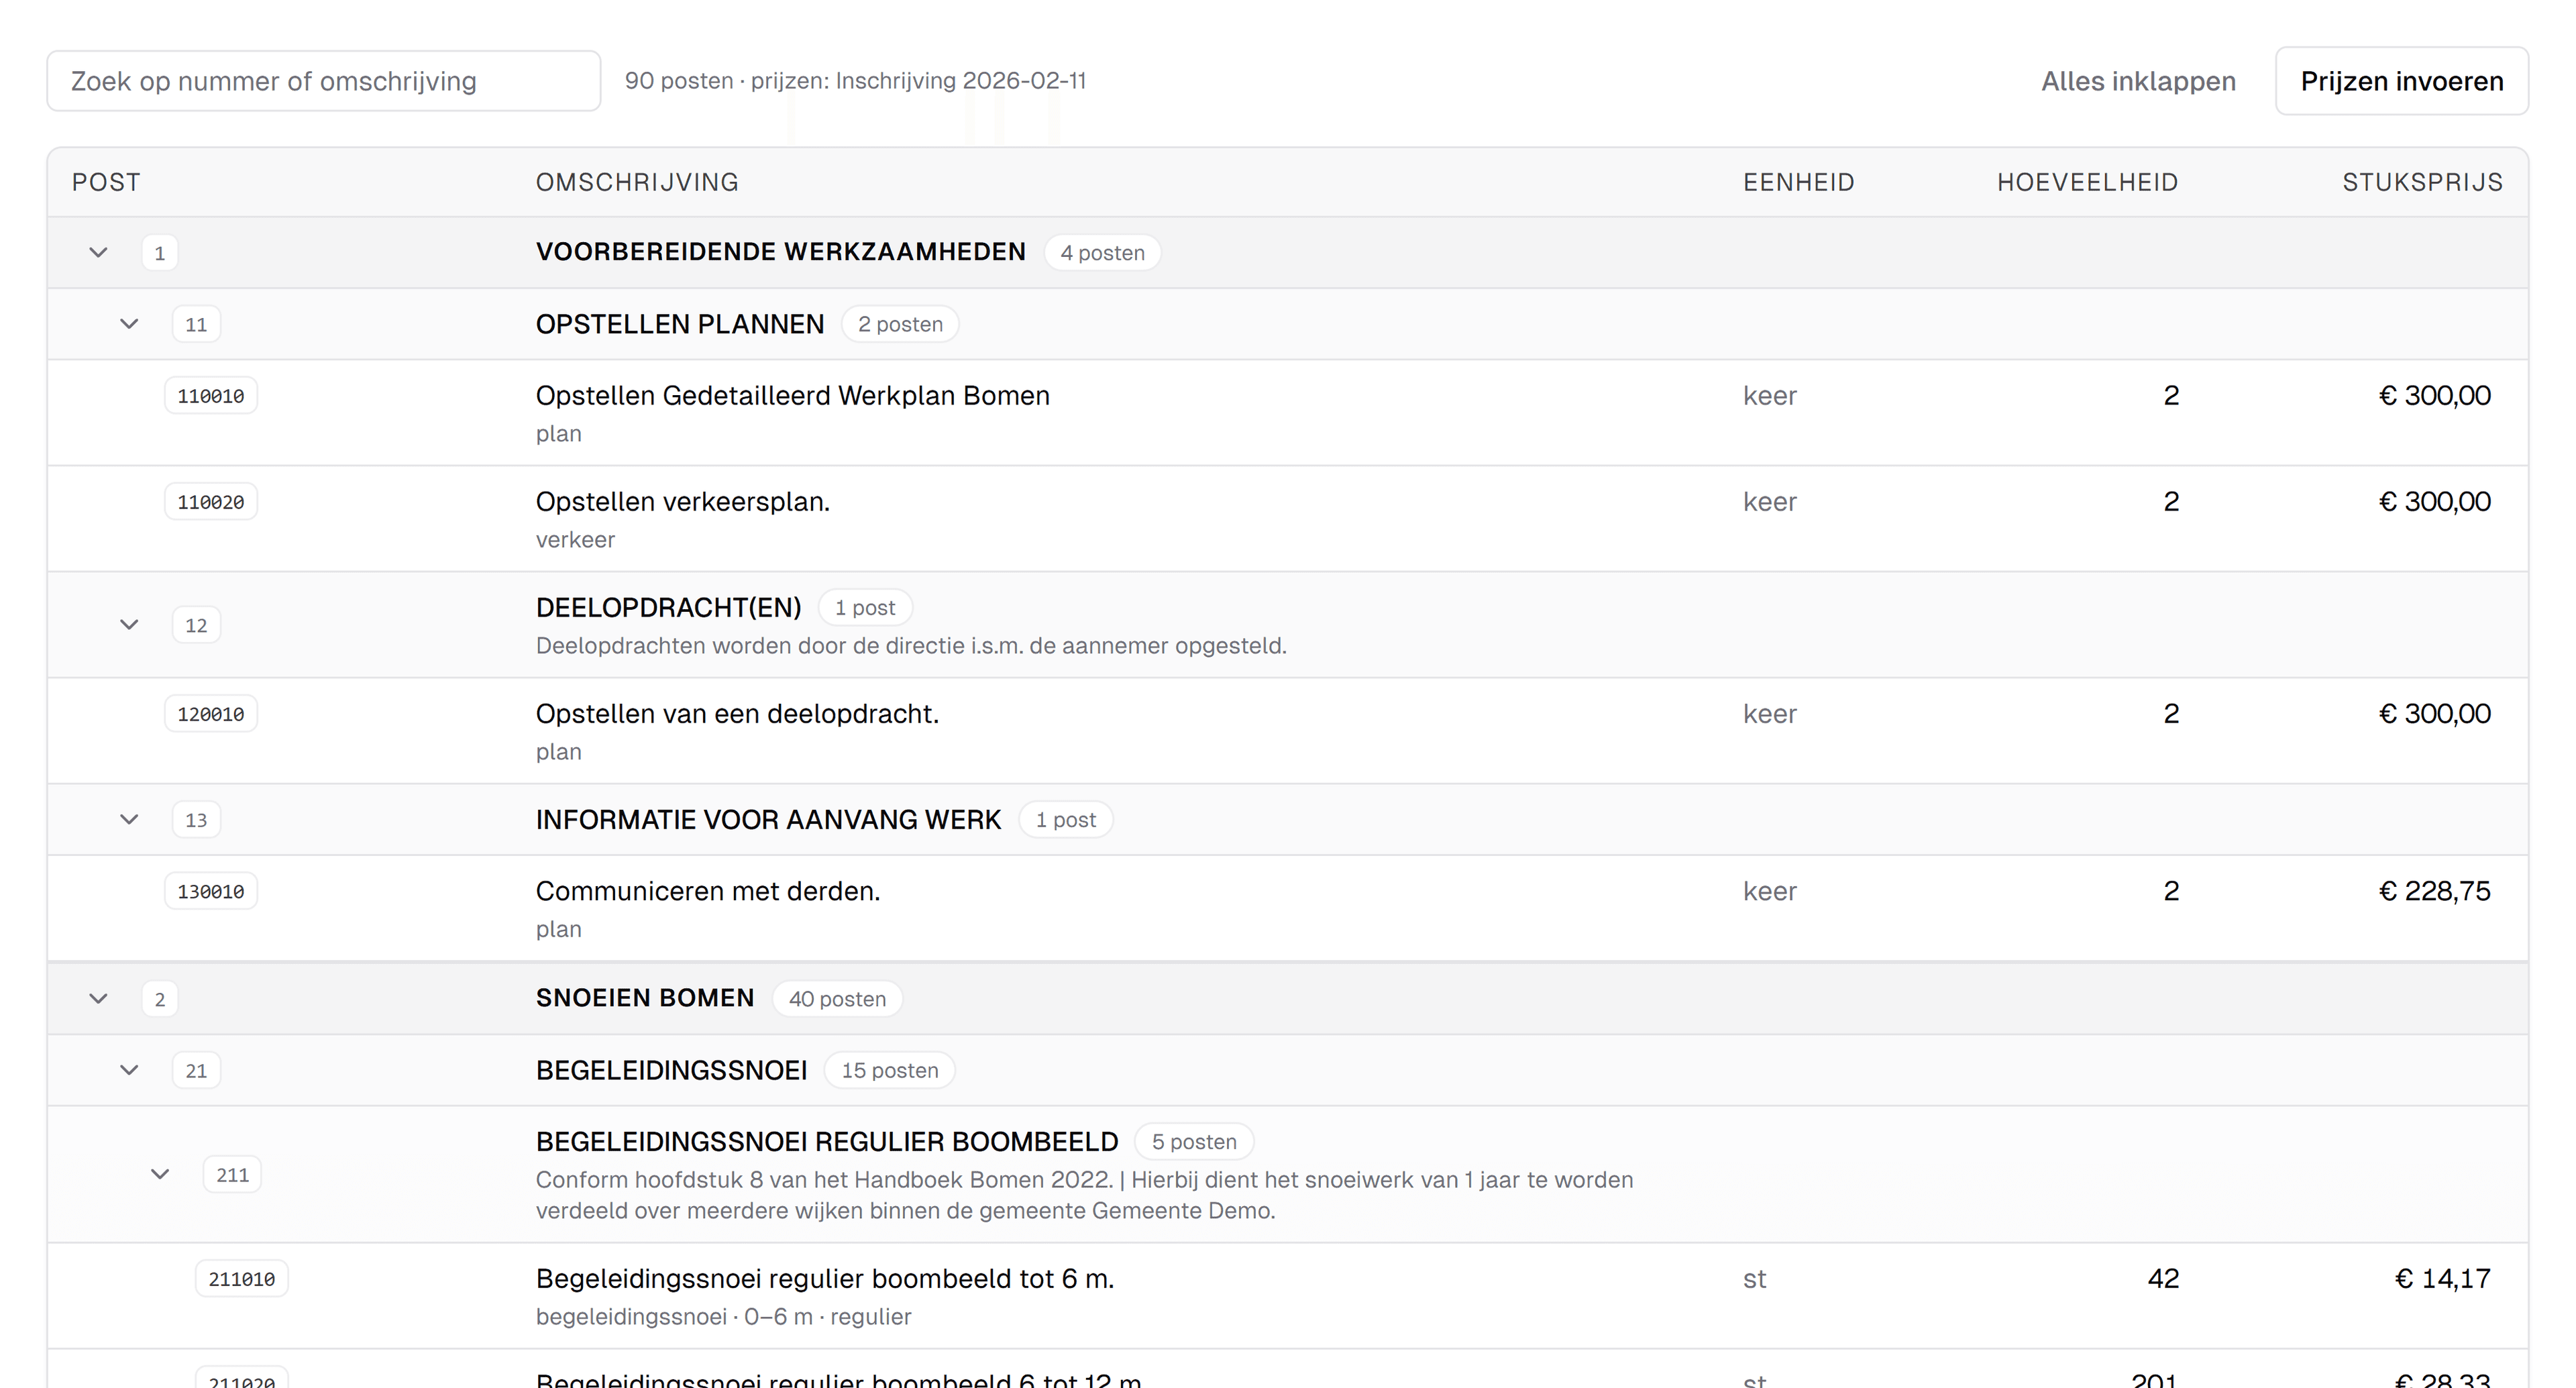
Load the RAW bestek (the Dutch tender specification) and IDA knows the items and the prices. Link a contract to a project and every tree gets a price based on its current BVC values. The manager estimates with it. A contractor sees the quantities inside their project.

  • All items from your specification in one price list.
  • You record once which item belongs to which work, and IDA suggests the match.
  • A total estimate per project, and a reason per tree when no item matches.
  • The costs of a selection show directly on the map, and the field worker sees their quantity breakdown in the field app.

Used by Admin and beheerder (manager); field workers see the quantities in the frontoffice.

IDA · Contract · Posten
The price list of a contract in IDA: 90 items from the specification, each with its number, description, unit, quantity and unit price.

Maintenance models

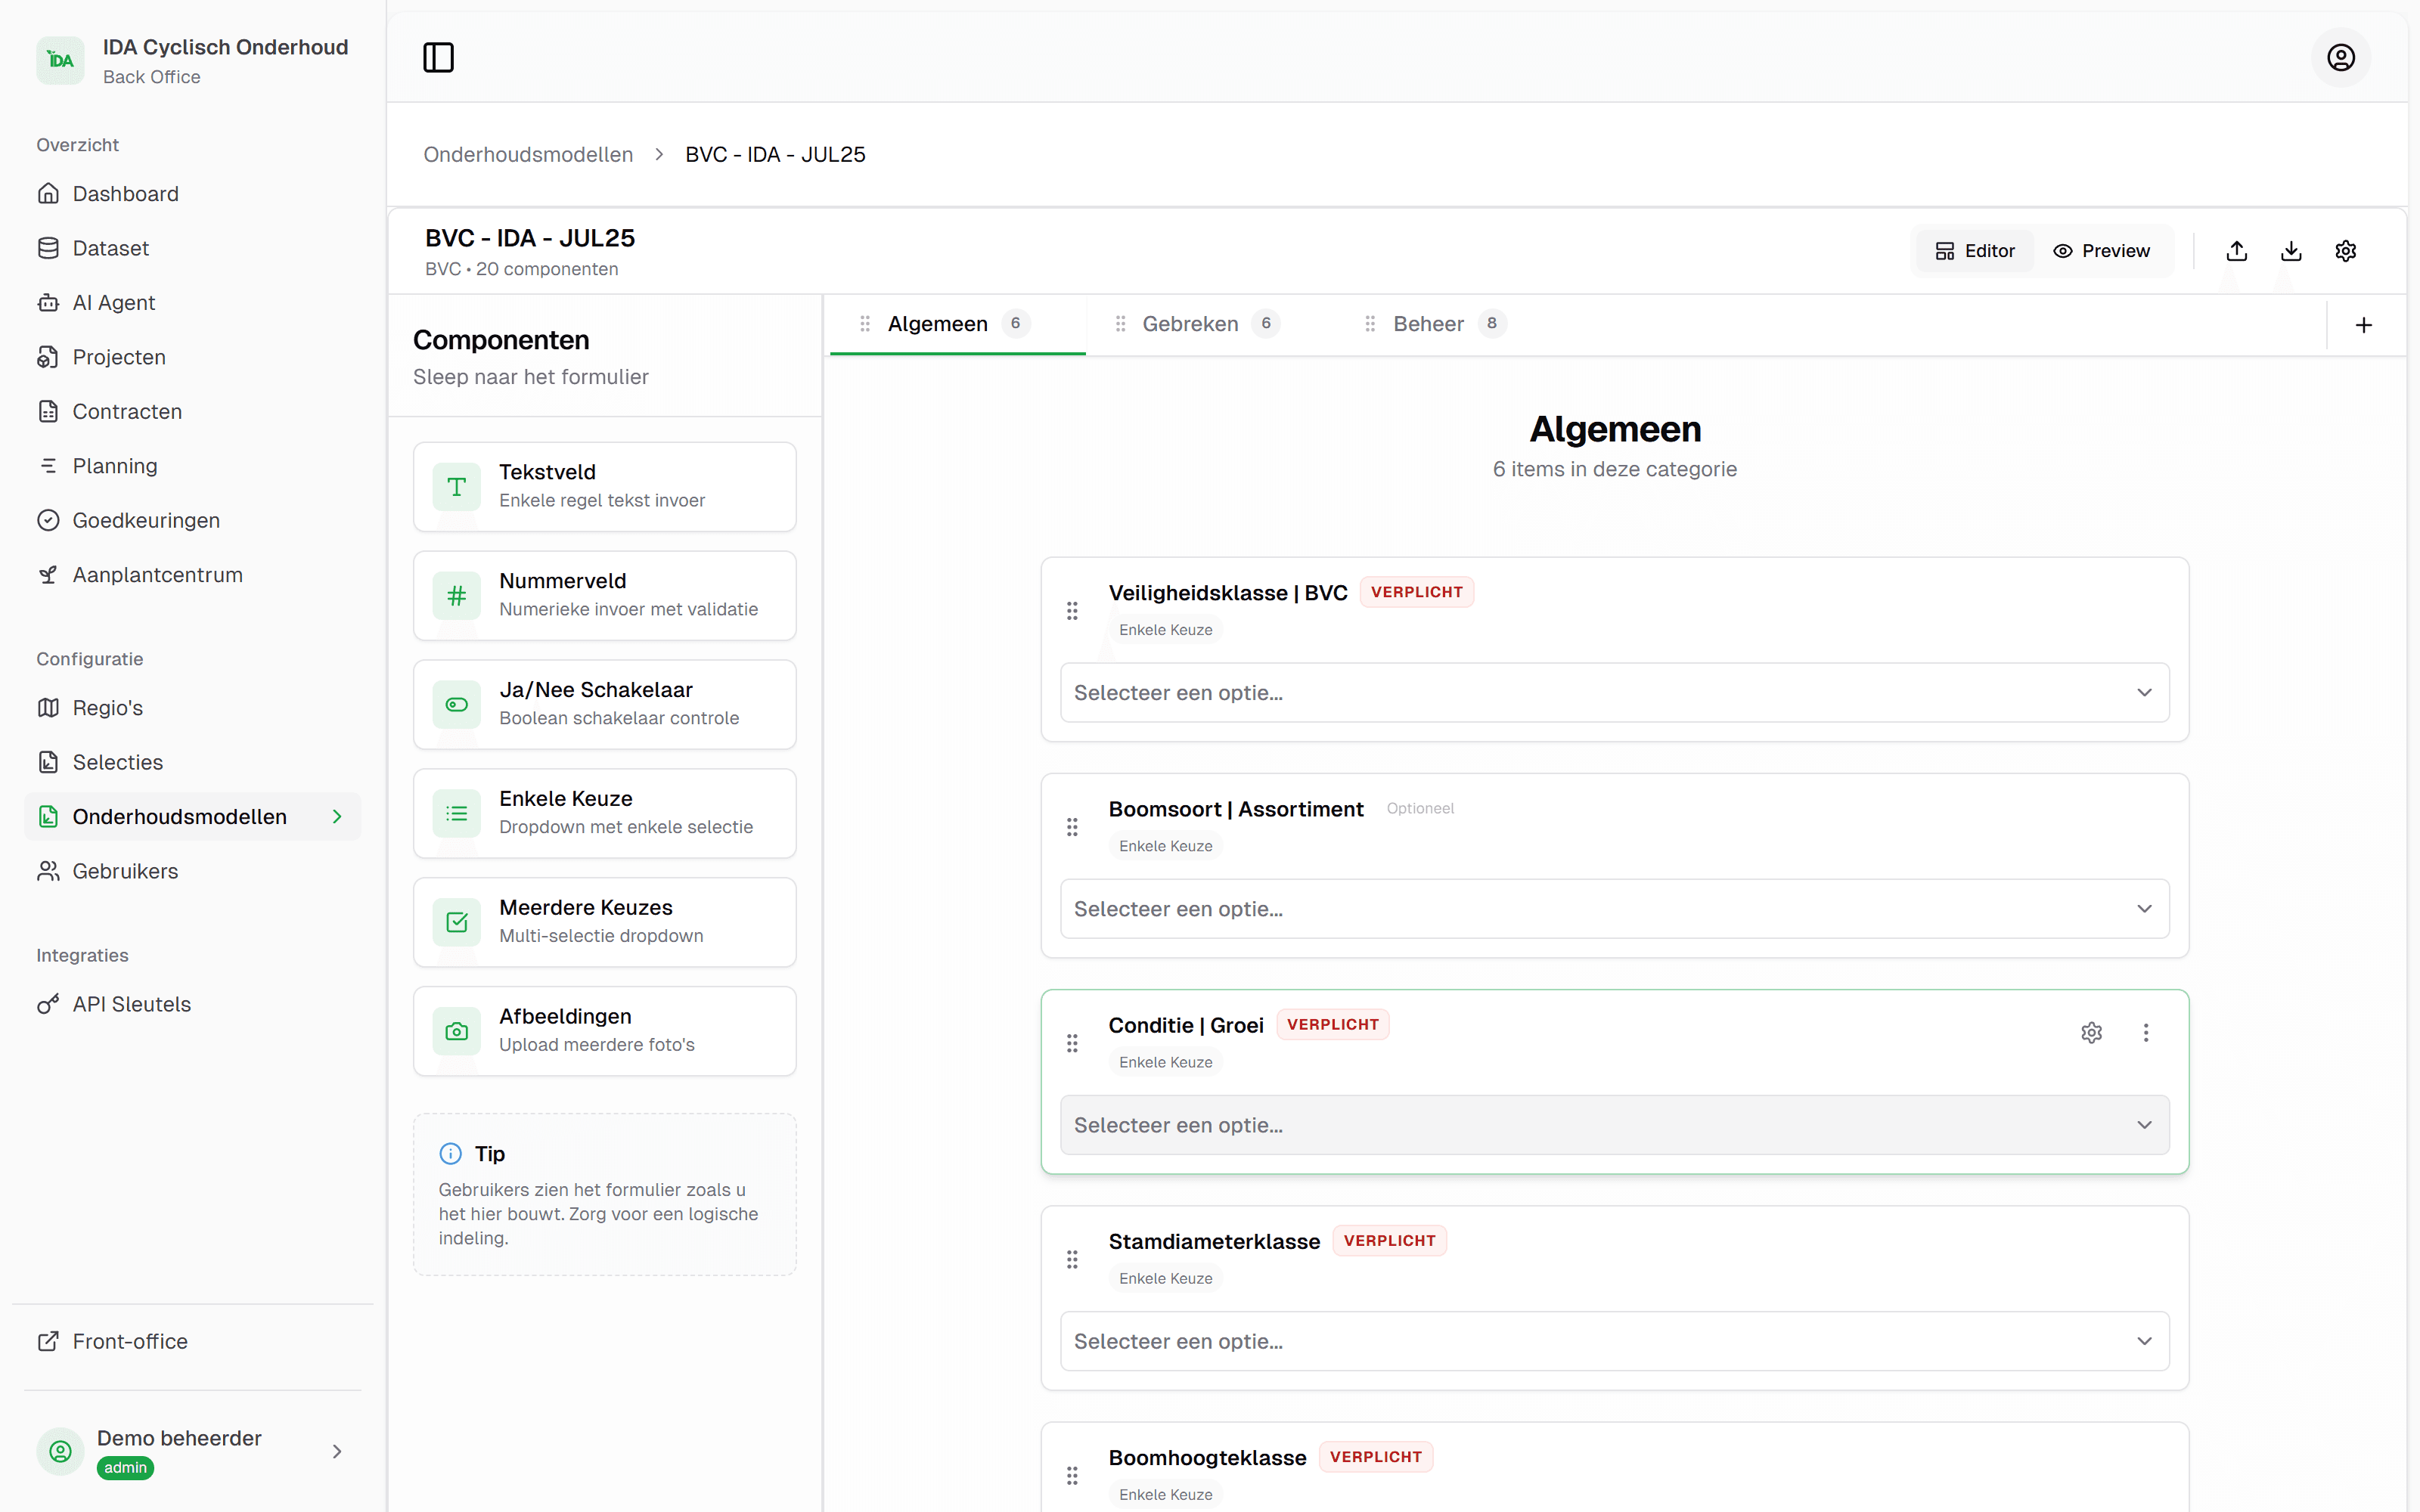
A maintenance model is the form the field worker fills in. You build it yourself, and it thinks along: the field worker sees the questions that belong to this tree. IDA ships standard models for BVC, pruning and felling.

  • From choice list to photo: you put together your own questions and drag them into the right order.
  • Questions appear, become required or fill themselves in, depending on what has already been entered.
  • The BVC model uses the sector's classes, such as Veiligheidsklasse (safety class), Conditie, Boomhoogteklasse and Beheeradvies.
  • You export a model and load it again elsewhere.

Used by Admin.

IDA · Onderhoudsmodel
The form editor of a maintenance model in IDA: the categories Algemeen, Gebreken and Beheer as tabs and the fields of the BVC model, required or optional.

API and integrations

With the API you connect IDA to your own systems. An integration may do what the user may do in IDA: the API follows the same project permissions.

  • Project data, statistics, mutations, status and location, available to your own systems.
  • You arrange access per organisation and withdraw it at any moment.
  • Every request is logged.
  • Exports as CSV, Excel, shapefile and GeoJSON. GeoPackage, KML and DXF can be delivered as well.

Used by Admin, together with whoever builds the integration.

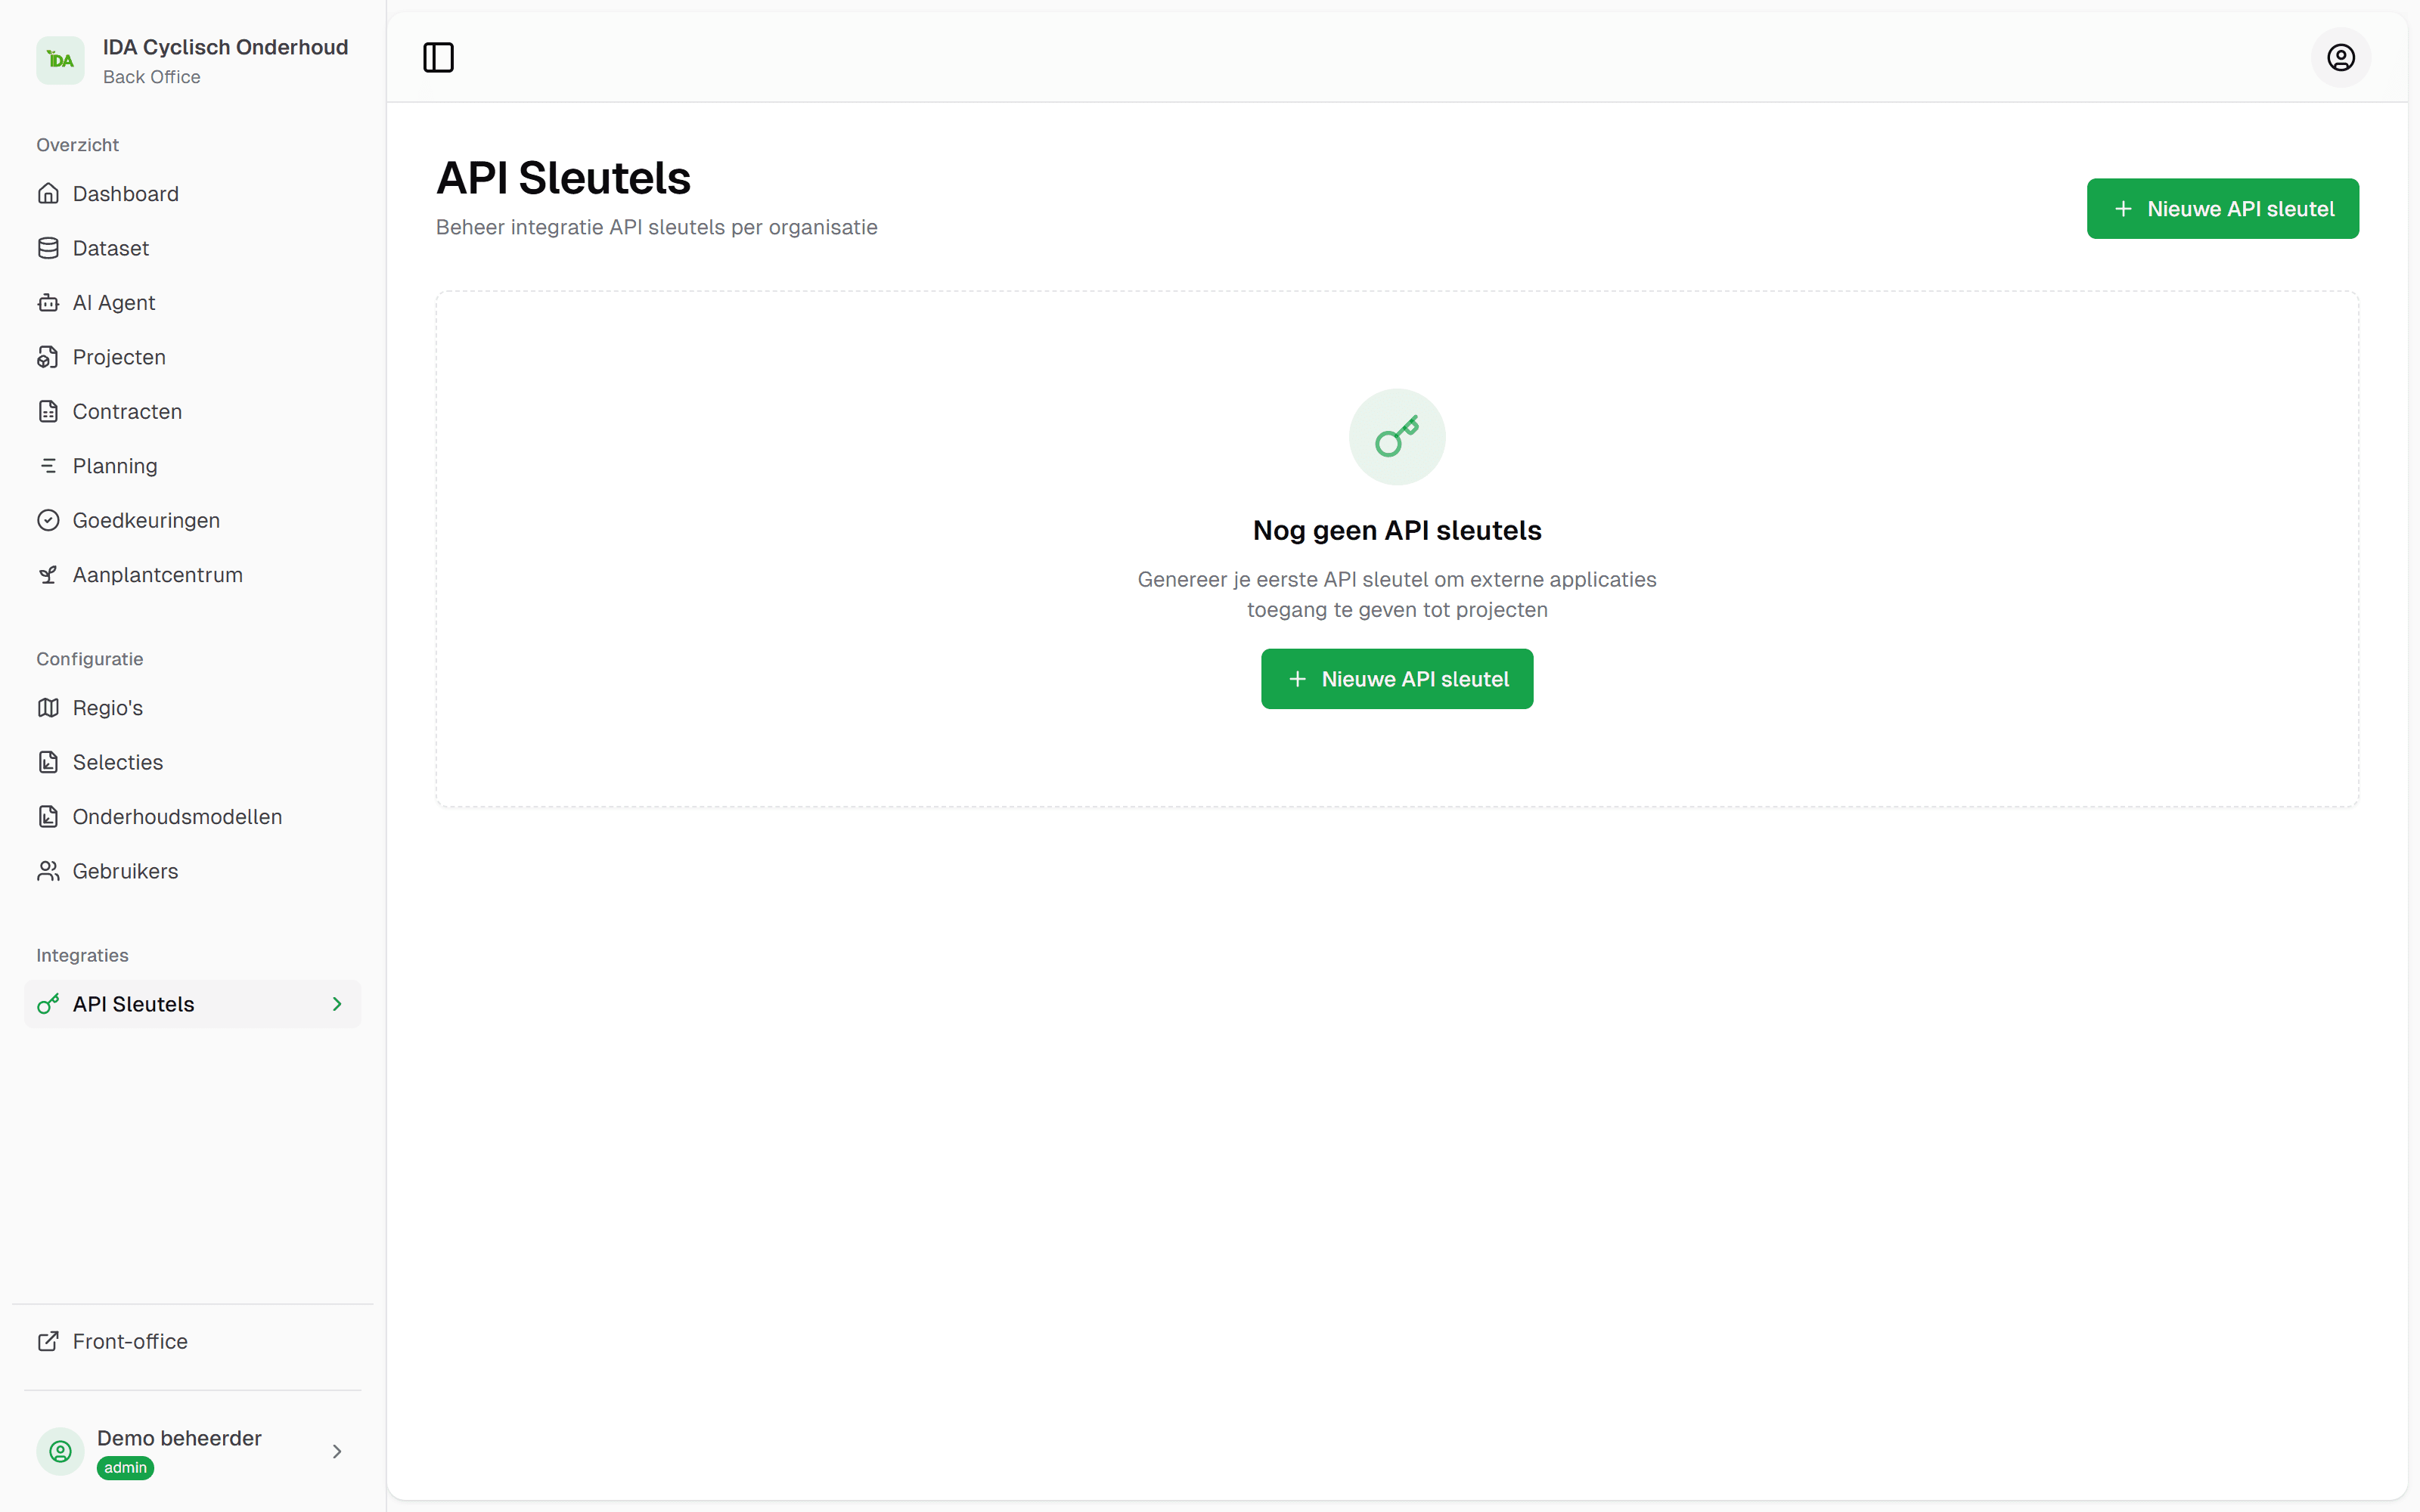
The header of the API keys page in IDA: managing keys per organisation.

See your own tree inventory in IDA

Send us your tree inventory, as a shapefile, an Excel list or whatever you have, and we will show IDA on your own trees, from your own file to the approval of field work.

  • Online
  • No obligation
  • With or without your own dataset

Used by

  • Municipality of Gulpen-Wittem
  • Municipality of Beekdaelen
  • Municipality of Beek
  • Municipality of Landgraaf
  • Municipality of Stein
  • Municipality of Maastricht
  • Algemene Bomendienst Limburg