Prioritising risk trees when the budget falls short
After the inspection round there are more risk trees on the list than you can deal with this year. This practice scenario shows how you reach an order you can explain to the council, residents and the insurer: the inspector's assessment of the tree, next to a risk score for the place where it stands. It describes practice in the Netherlands, where the round is a BVC, the Dutch tree safety inspection.
6 min read
The situation: more risk trees than budget
The inspection round is done. Your inspectors have assessed every tree, and the list of risk trees and attention trees (Risicoboom and Attentieboom, two of the Dutch safety classes) is longer than last year. The maintenance budget is not. You can have part of the measures carried out this year, and the rest moves on to the next.
That in itself is not a problem. No municipality deals with everything at once, and the duty of care for trees does not ask for that either. What is asked of you is an order you can defend. The alderman wants to know why one avenue is dealt with this year and the other next year. A resident wants to know why the tree outside their door is still standing. And if something does happen, an insurer wants to see that you made a reasoned choice and not an arbitrary one.
IDA Bomen gives you that order: a risk score per tree, based on what stands within its fall zone, next to your inspector's assessment.
Two questions per tree: the likelihood and the consequence
A tree safety inspection (BVC, boomveiligheidscontrole, the Dutch tree safety inspection) answers the first question: how likely is it that this tree, or part of it, fails? The inspector looks at defects and condition and gives a Veiligheidsklasse (safety class), an urgency and a management advice.
The second question is what happens if it goes wrong. A risk tree at the edge of a meadow and a risk tree next to the entrance of a primary school have the same class and a very different consequence. In places where many people come, your duty of care weighs more heavily too. An experienced tree manager knows that and knows their area. But with a list of hundreds or thousands of trees, knowledge of the area soon becomes a feeling, and a feeling is hard to explain in a committee meeting.
A risk score per tree
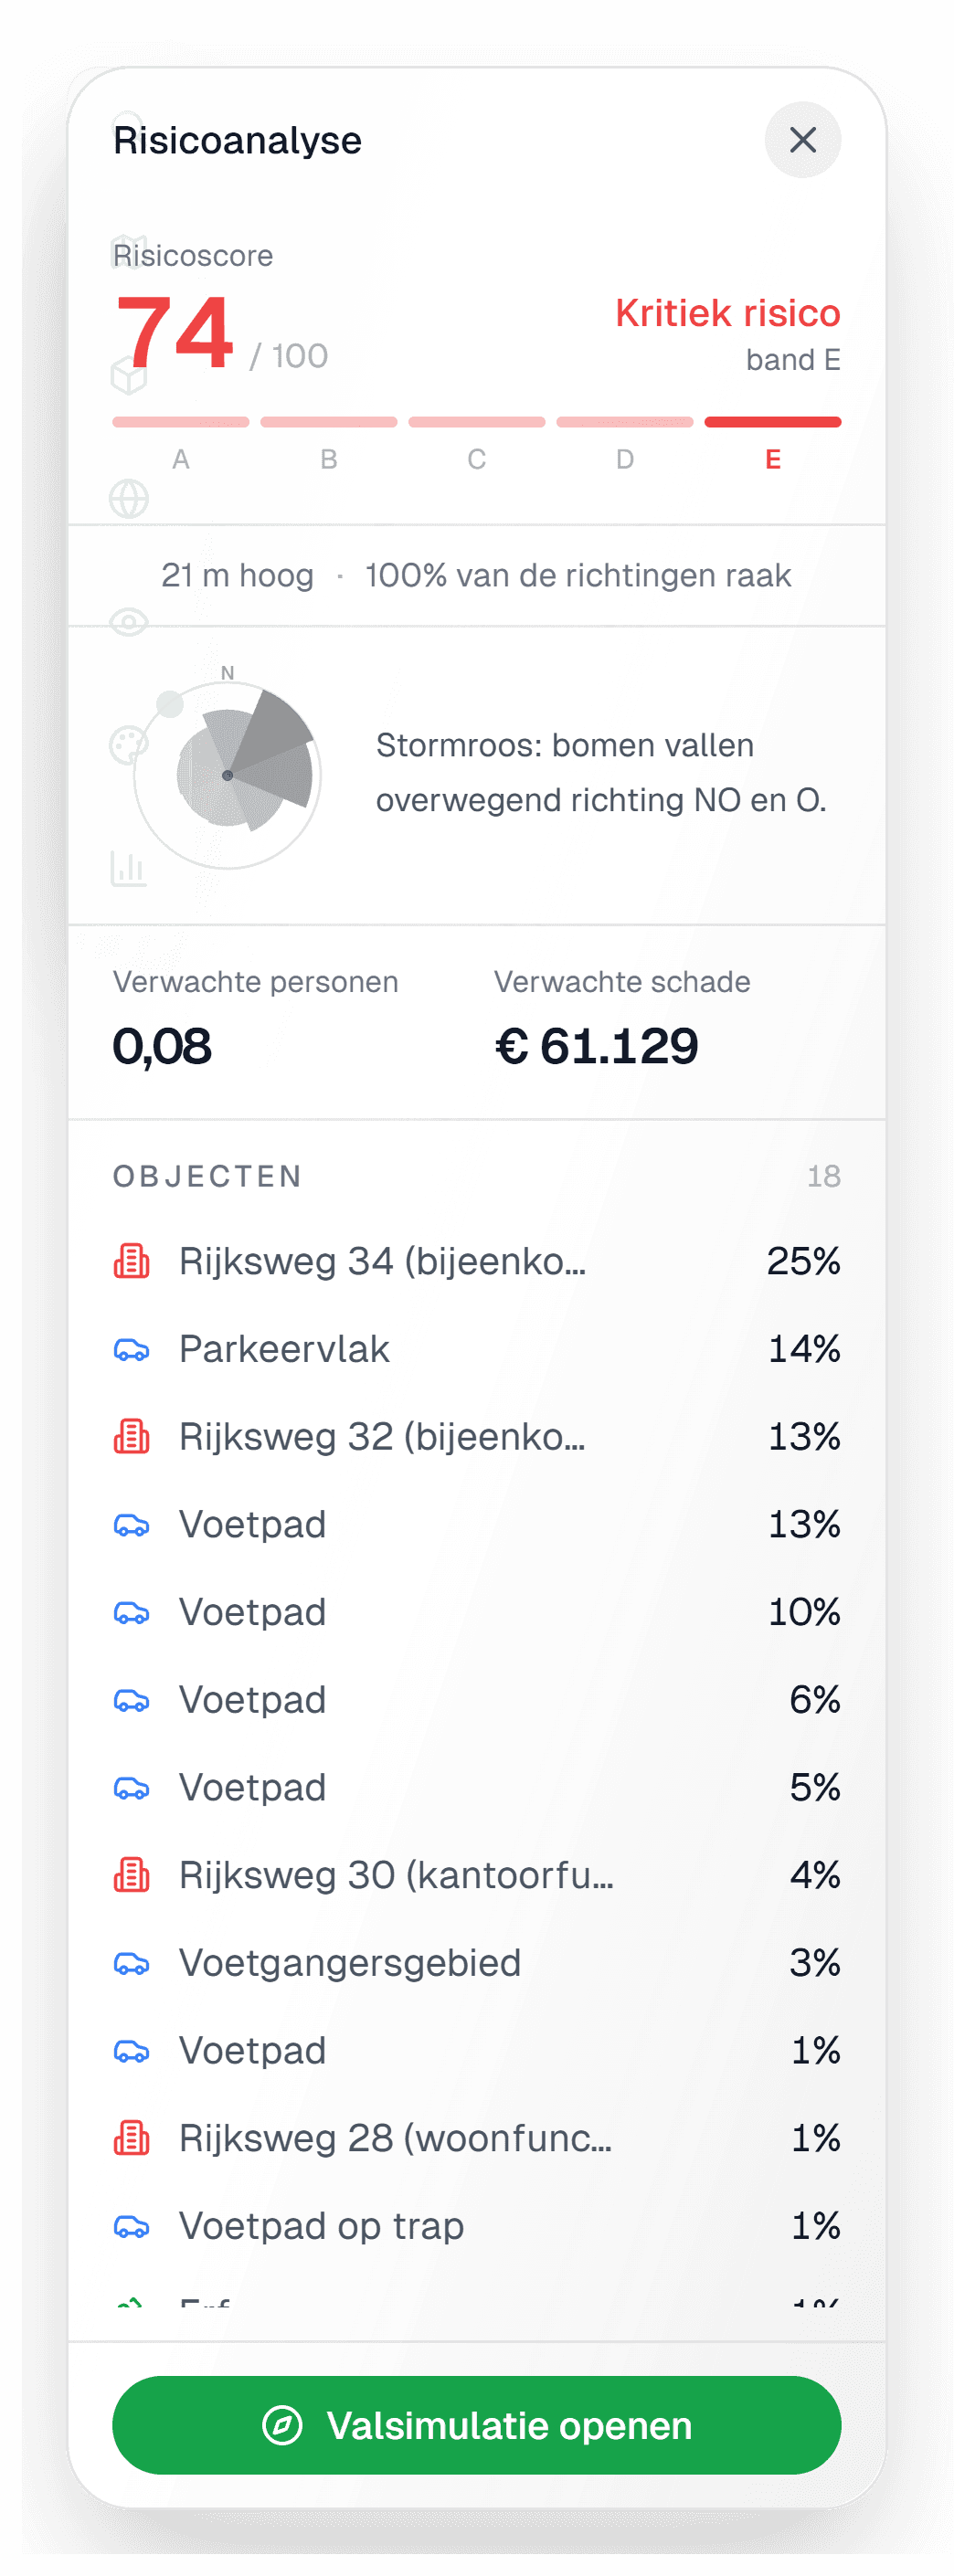
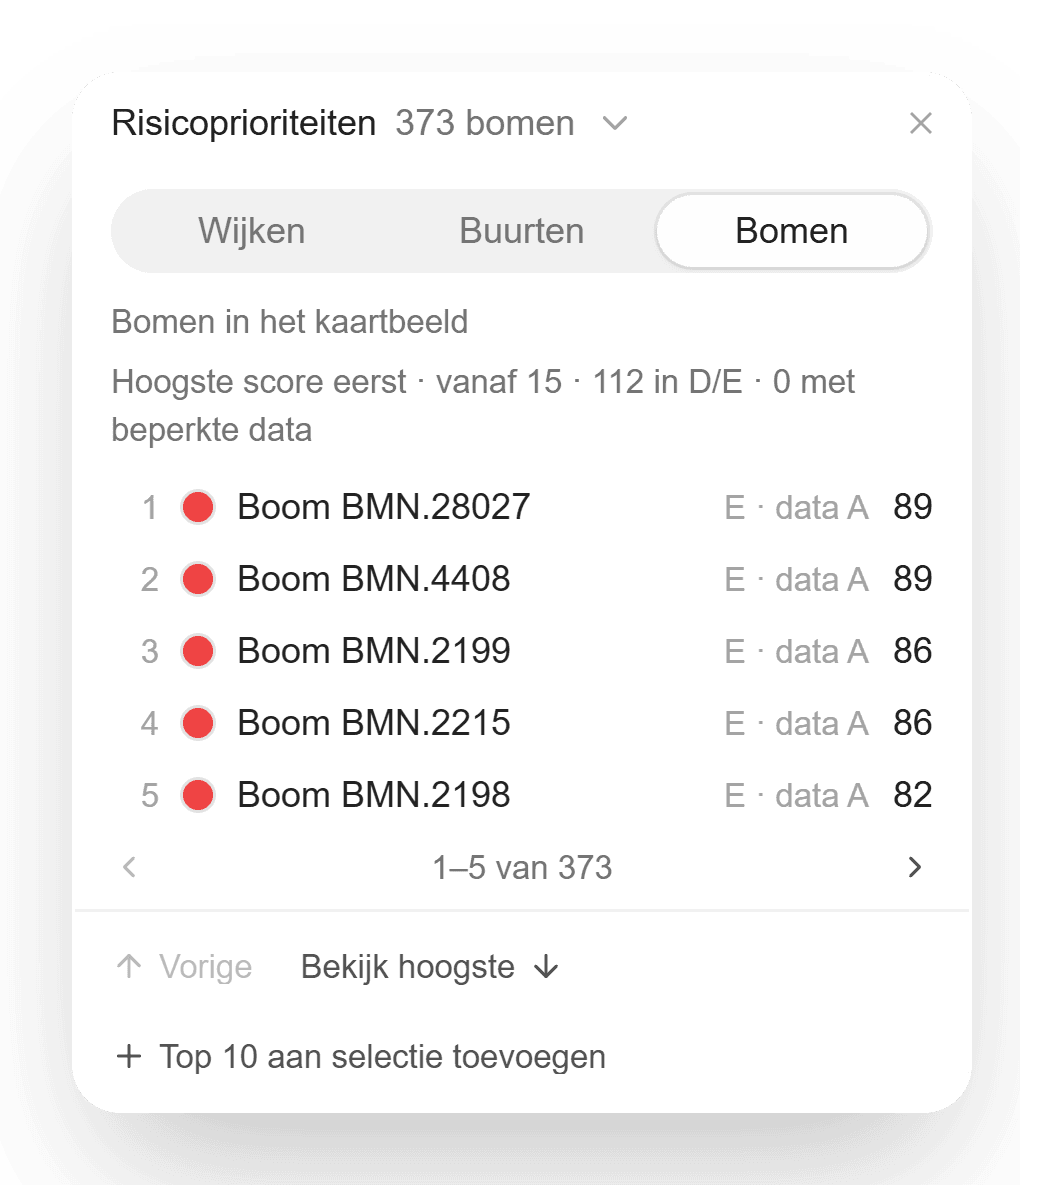
IDA puts a risk score from 0 to 100 next to every tree, divided over five bands from A to E. The score weighs how many people come within the fall zone of the tree and what property stands there. Which buildings and roads those are comes from the Dutch national registers. The fall direction follows the prevailing storm wind. Risk prioritisation is a module of IDA.
Per tree you see where the score comes from: the height of the tree, the objects in the fall zone and, per object, its share of the people who come there. That is the difference between a number and a substantiation. You do not have to say that the system ranks this tree high. You can show that it is 21 metres tall and reaches over a shop building, a parking bay and a footpath.
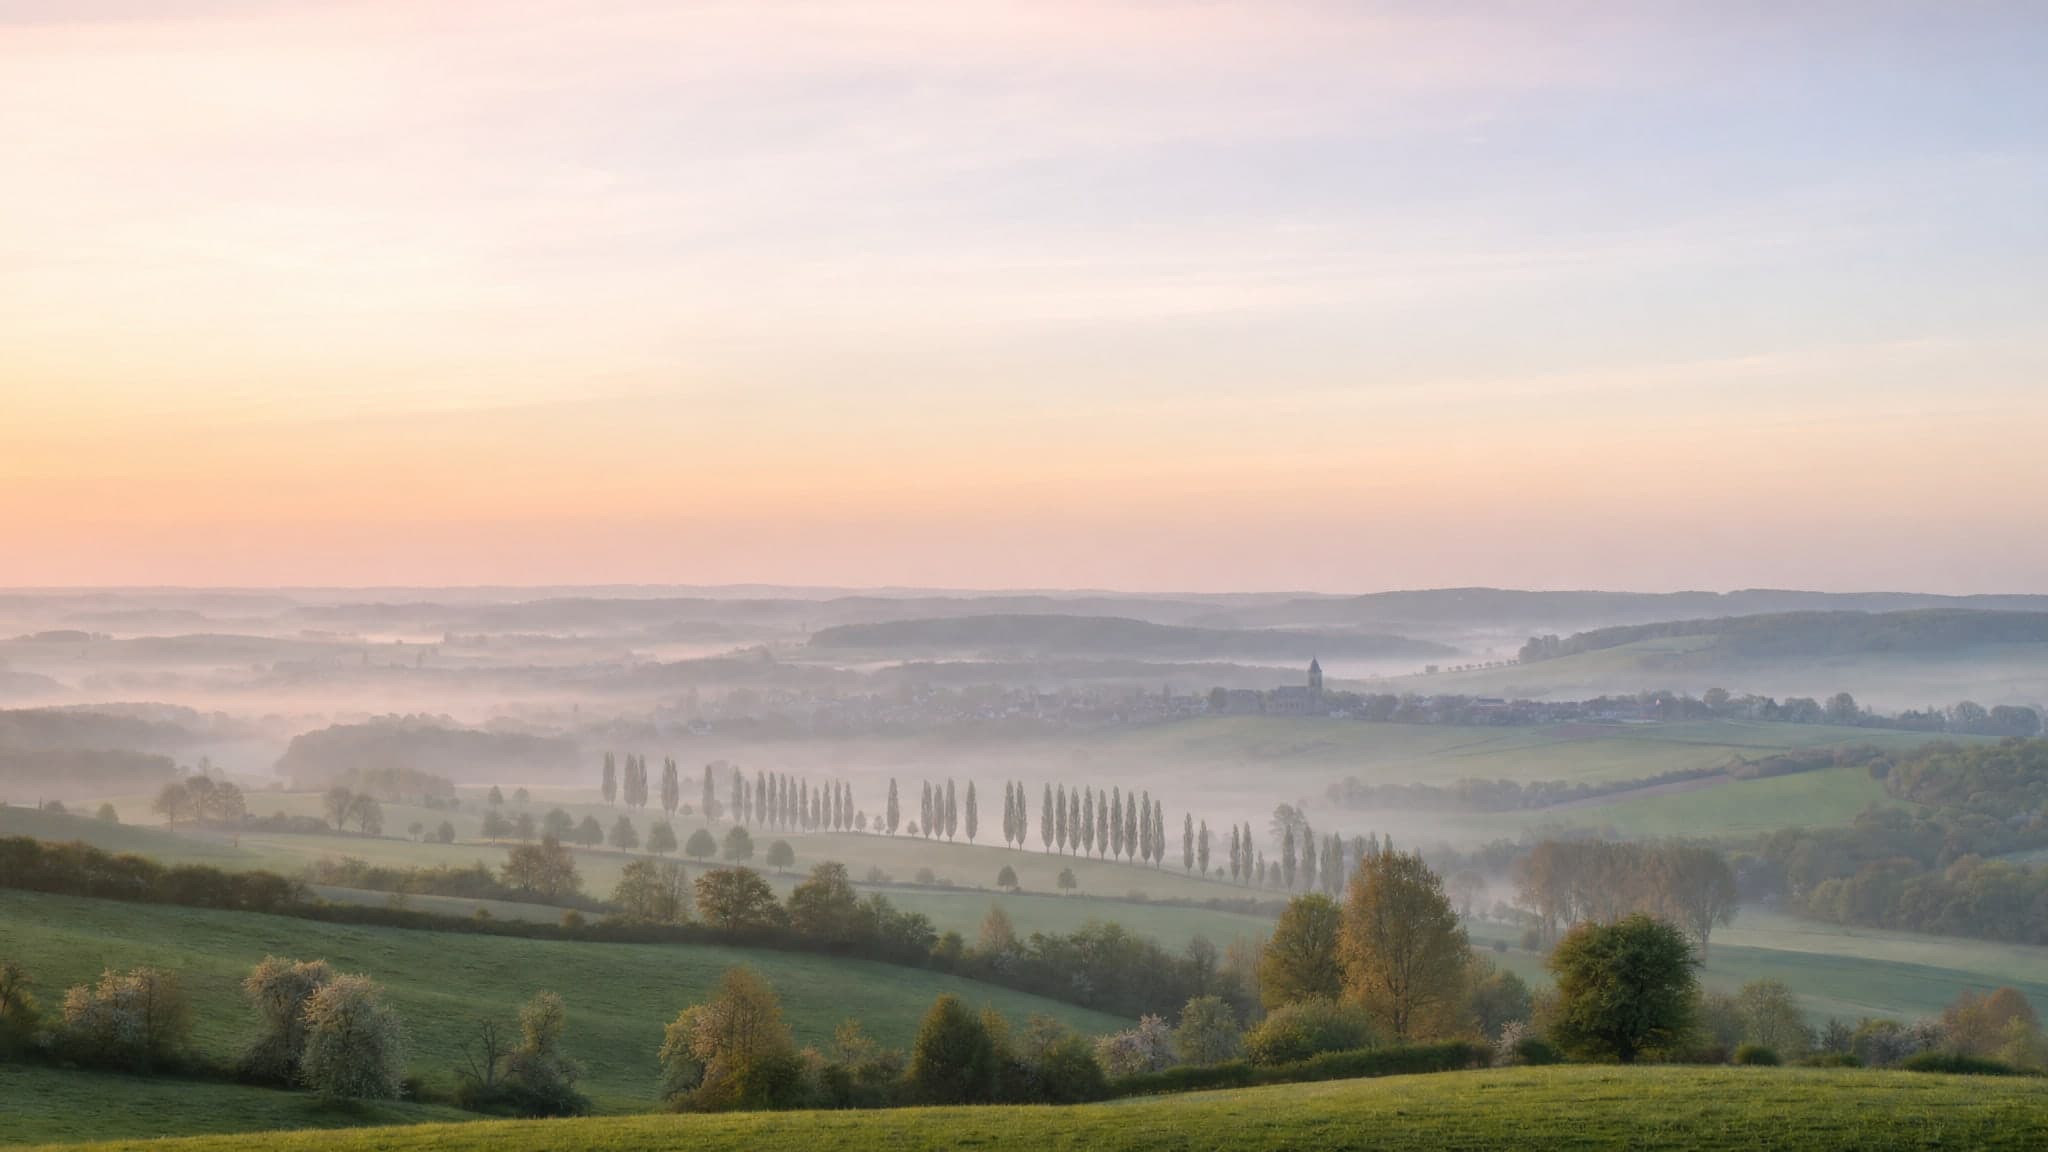
The scores are on the map as well, as the risk skyline: a column per tree, whose height is the score. A street with tall columns stands out before you have opened a single list.
Prioritising risk trees in five steps
Filter on what the inspector found
Start with the outcome of the BVC: the risk trees and attention trees with a management advice that is still open. That is the group where something has to be done.
Put the risk band next to it
Within that group, filter on location risk, from the band you choose. What remains are trees with a defect in a place where the consequence is large. IDA puts the highest scores first, per tree, per neighbourhood or per district.
Work it through against your budget
Ask IDA's AI agent for budget scenarios: how much risk you take away per euro, priced against your contract. That way you see what a larger or smaller budget delivers.
Turn the selection into a project
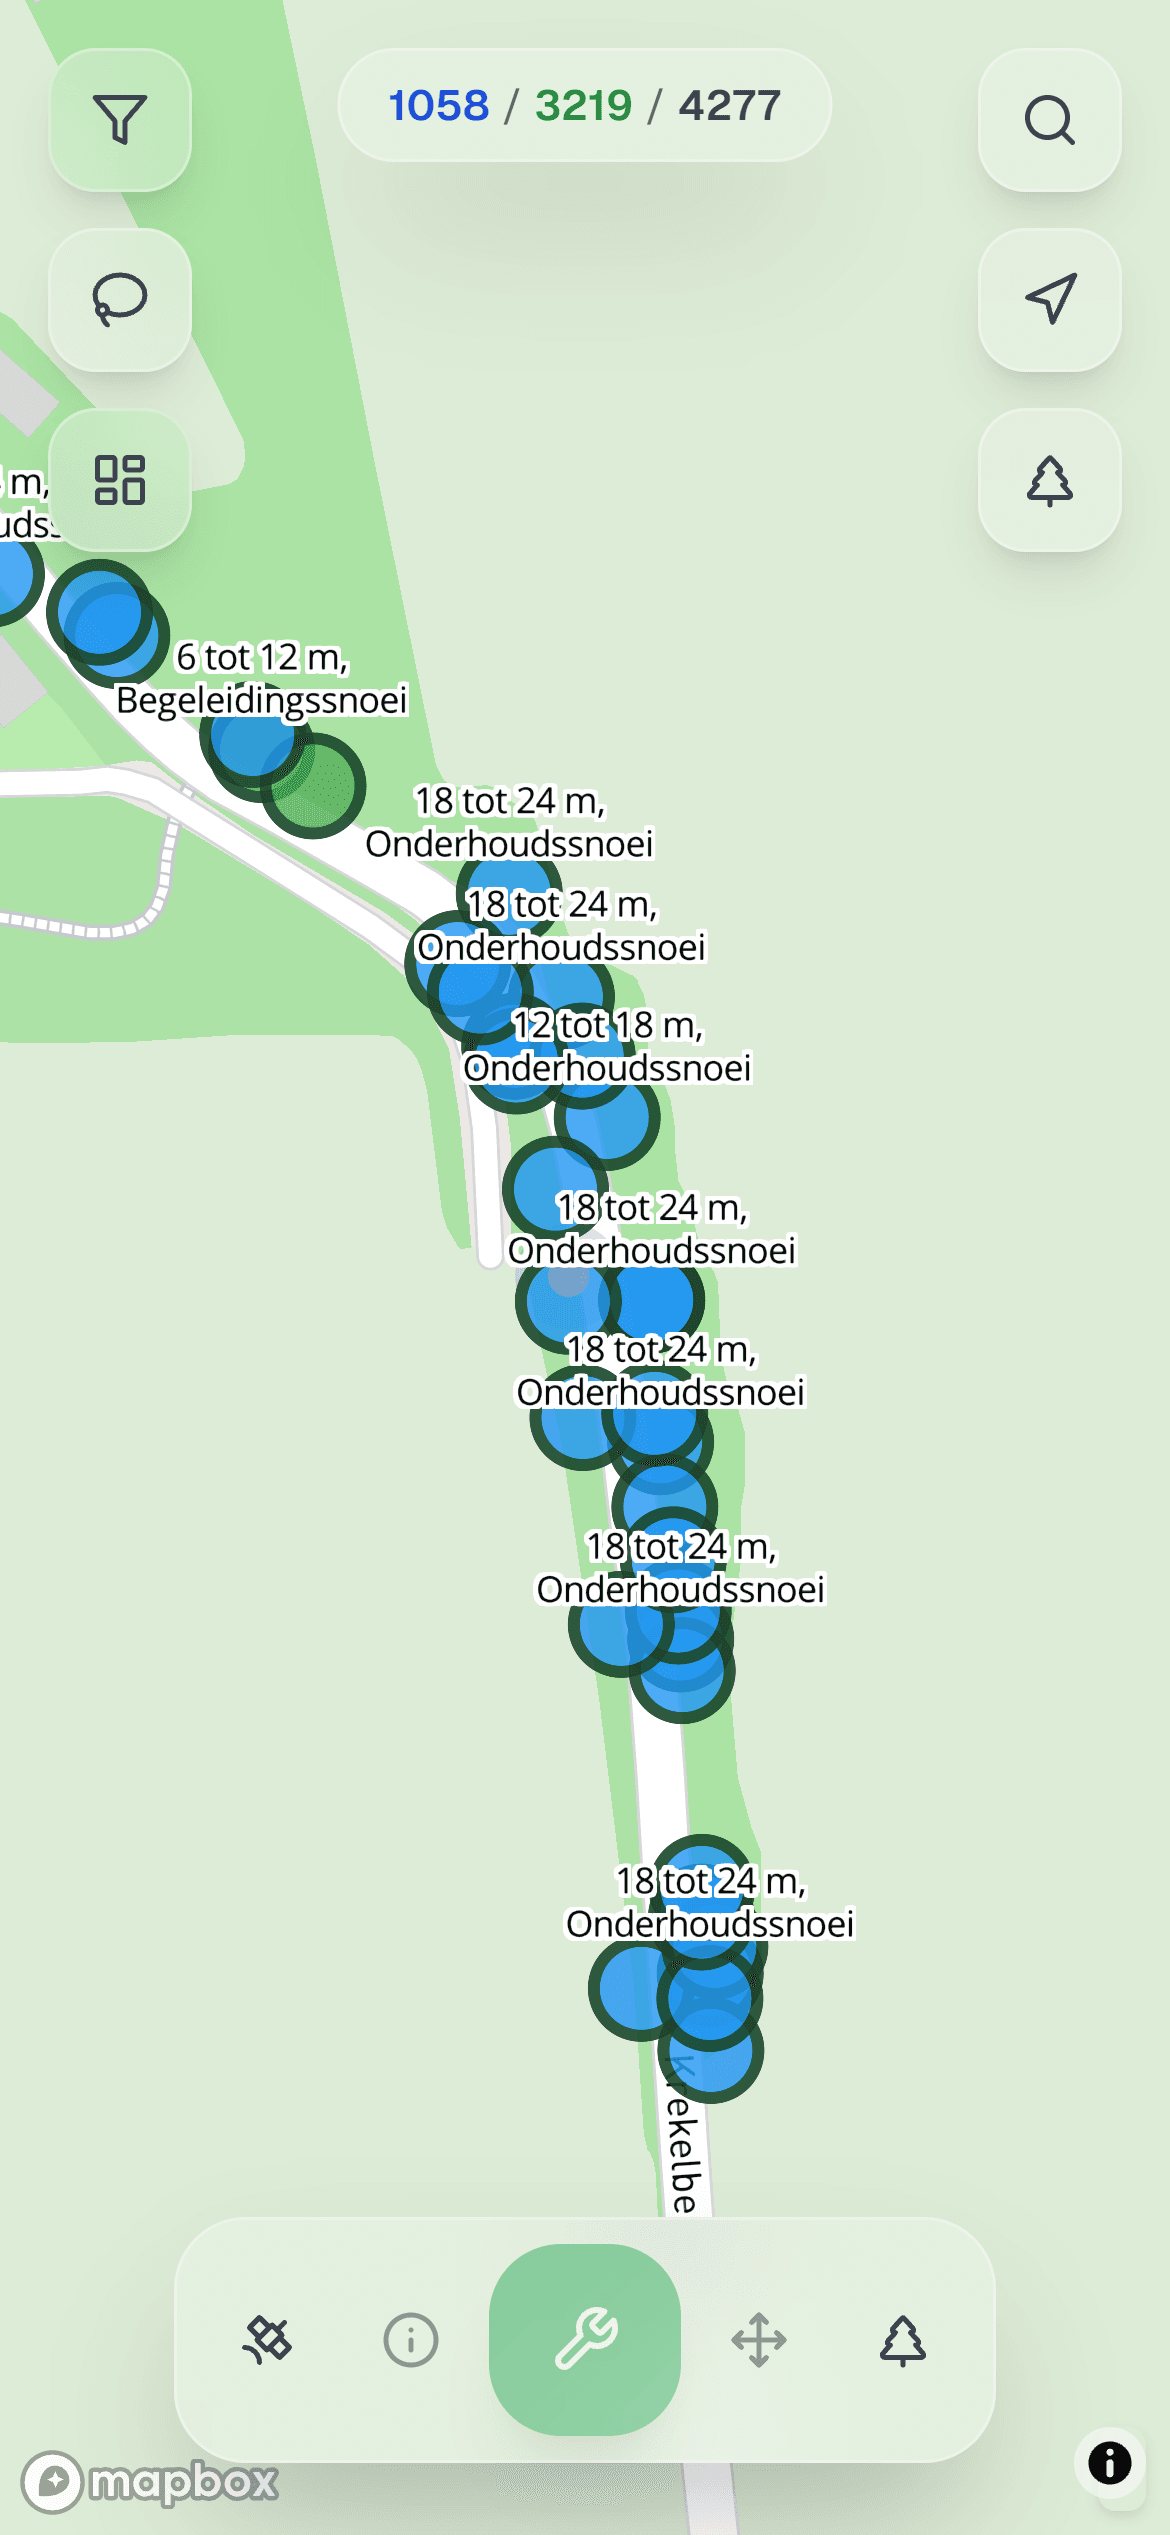
The trees you choose become a project in one action, with the form the crew fills in. Your contractor sees them on the map, with the measure per tree.
Save the selection
Save the group that moves on as well. A saved selection stays current: next year it holds what is still open then.
Explaining the choice to the council and residents
The conversation with the alderman changes. You do not come with a list and an amount, but with a map and a line of reasoning: these are the trees where the inspector found a defect, these are the places where most people come, and with this budget we take away the largest part of the risk. Whoever wants to achieve more sees what that costs. Whoever wants to cut back sees what is then left standing.
The same works for residents. The question why the tree outside the door has not been dealt with yet has an answer you can show: it is on the list, it has been assessed, and the trees at the school and along the through road come first.
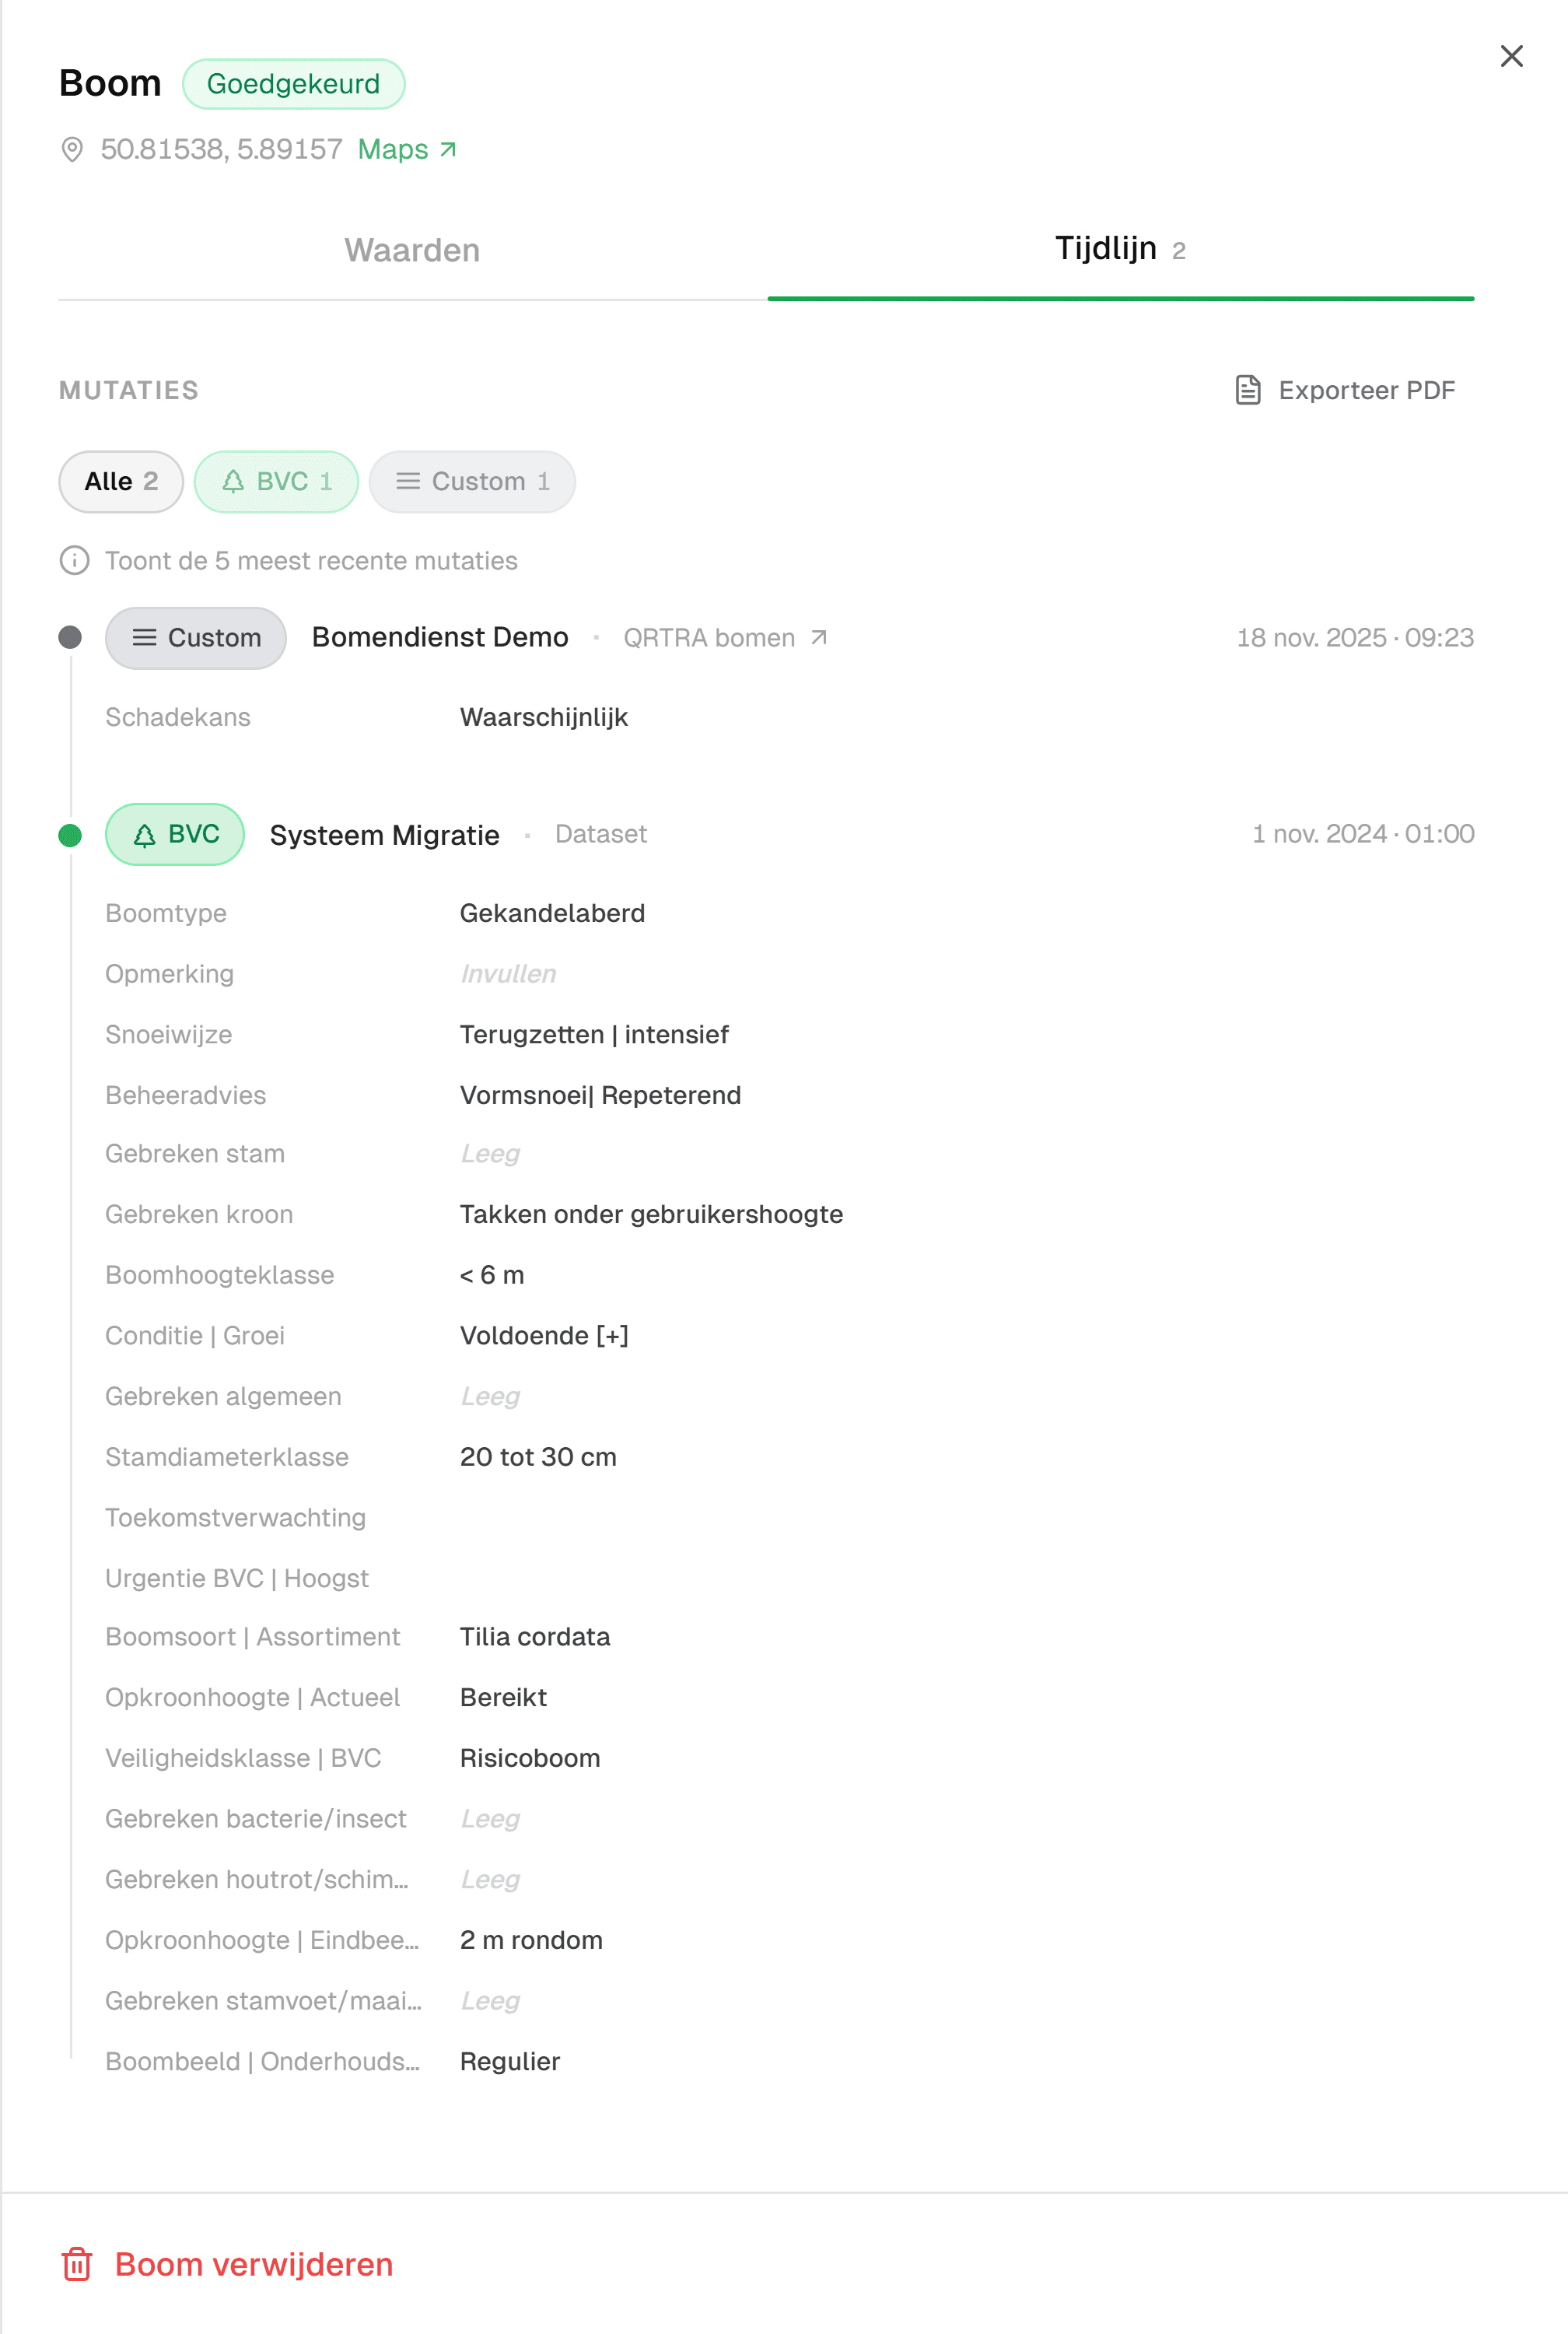
And the order itself becomes part of your dossier. With every tree it says what the inspector recorded, when, and what was done with it. If a measure moves on, it is visible that this was a choice within a reasoned approach. What such a dossier is worth when damage occurs is in the practice scenario on the tree dossier for a damage claim.
Following whether the risk goes down
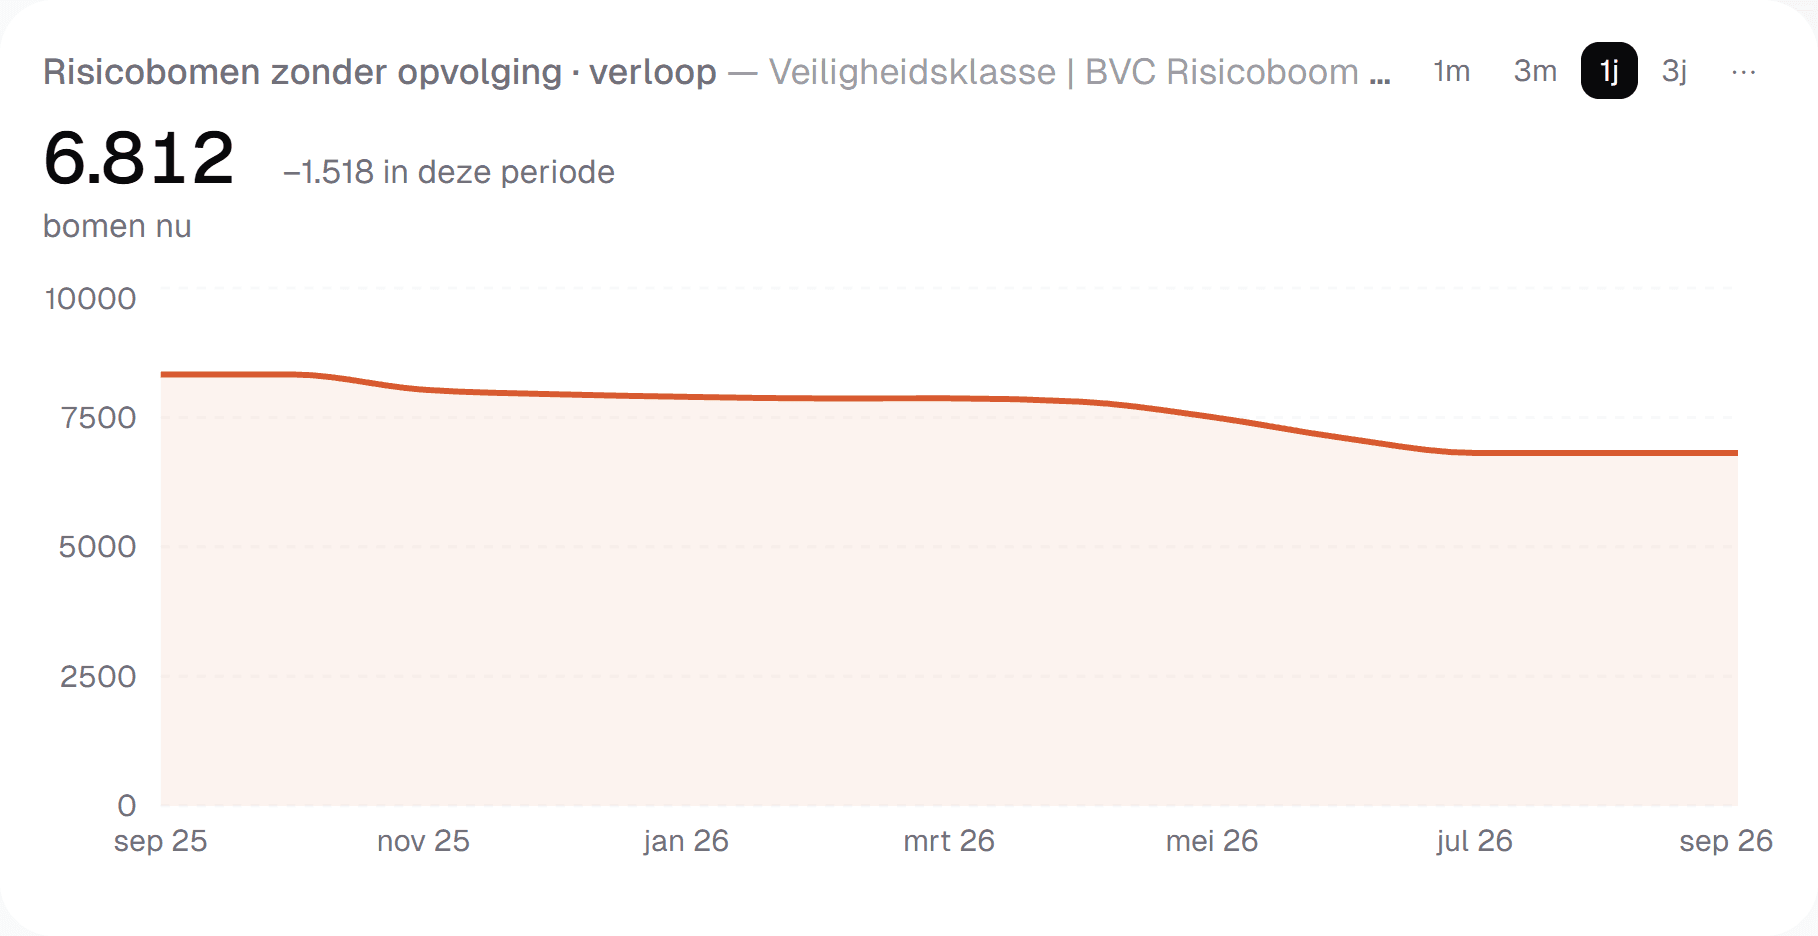
Prioritising is not a one-off exercise. During the work you see in the project how many trees are finished. You put the selection of risk trees without follow-up on your dashboard as a chart. That line should go down, and if it does not, you see that in the week it happens and not at the next inspection round.
After the work the result sits with the tree. The next inspection round starts with a tree inventory that is correct, and with a way of working you do not have to invent again.
Frequently asked questions
Start with the outcome of the tree safety inspection: the inspector's Veiligheidsklasse (safety class), urgency and management advice. Then weigh the place: how many people come there and what stands within the fall zone of the tree. IDA Bomen gives every tree a risk score for that, so that within the group of risk trees you put the highest consequences first.
The Veiligheidsklasse, the Dutch safety class, is the inspector's assessment of the tree itself, such as Attentieboom (attention tree) or Risicoboom (risk tree). The risk score says something about the place: what can be hit if the tree fails. In IDA Bomen they sit side by side. The class decides whether something has to happen, the score helps decide what comes first.
The duty of care asks that you inspect your trees and act on what you find, within the term the inspector advises. What poses an acute danger comes first. For the rest you may set an order, as long as it is reasoned and you can show it. So record why a measure moves on.
With a map and a line of reasoning instead of a list and an amount. Show where the inspector found defects, where most people come and how much risk the available budget takes away. In IDA Bomen you ask for budget scenarios, so the council sees what a larger or smaller budget means.
Read on
Tree dossier for a damage claim: what to show
A damage claim after a tree blows over: the insurer asks whether it was inspected. What you have to show, and how the tree dossier in IDA Bomen gives it.
6 min read
Outsourcing tree inspections: keep sight of the round
Outsourcing tree inspections and still seeing the progress: how your contractor's inspectors work in your own tree inventory in IDA Bomen.
6 min read
Duty of care for trees: what Dutch municipalities record
In the Netherlands the duty of care for trees follows from article 6:162 of the Civil Code. When a municipality is liable, and what you record per tree.
8 min read
See your own tree inventory in IDA
Send us your tree inventory, as a shapefile, an Excel list or whatever you have, and we will show IDA on your own trees, from your own file to the approval of field work.
Used by